Observables
In this section:
ThreatStream uses the terms observable and indicator of compromise (IOC) interchangeably.
For deeper analysis, you can drill down on individual observables by viewing observable details pages. To view observable details pages, click the link for the observable from any page in ThreatStream that displays observables as hyperlinks.
On an observable details page, you can:
- Drill down further on observables associated with the observable you started with.
- Export observable details.
- Edit the observable fields. See Editing Observable Details.
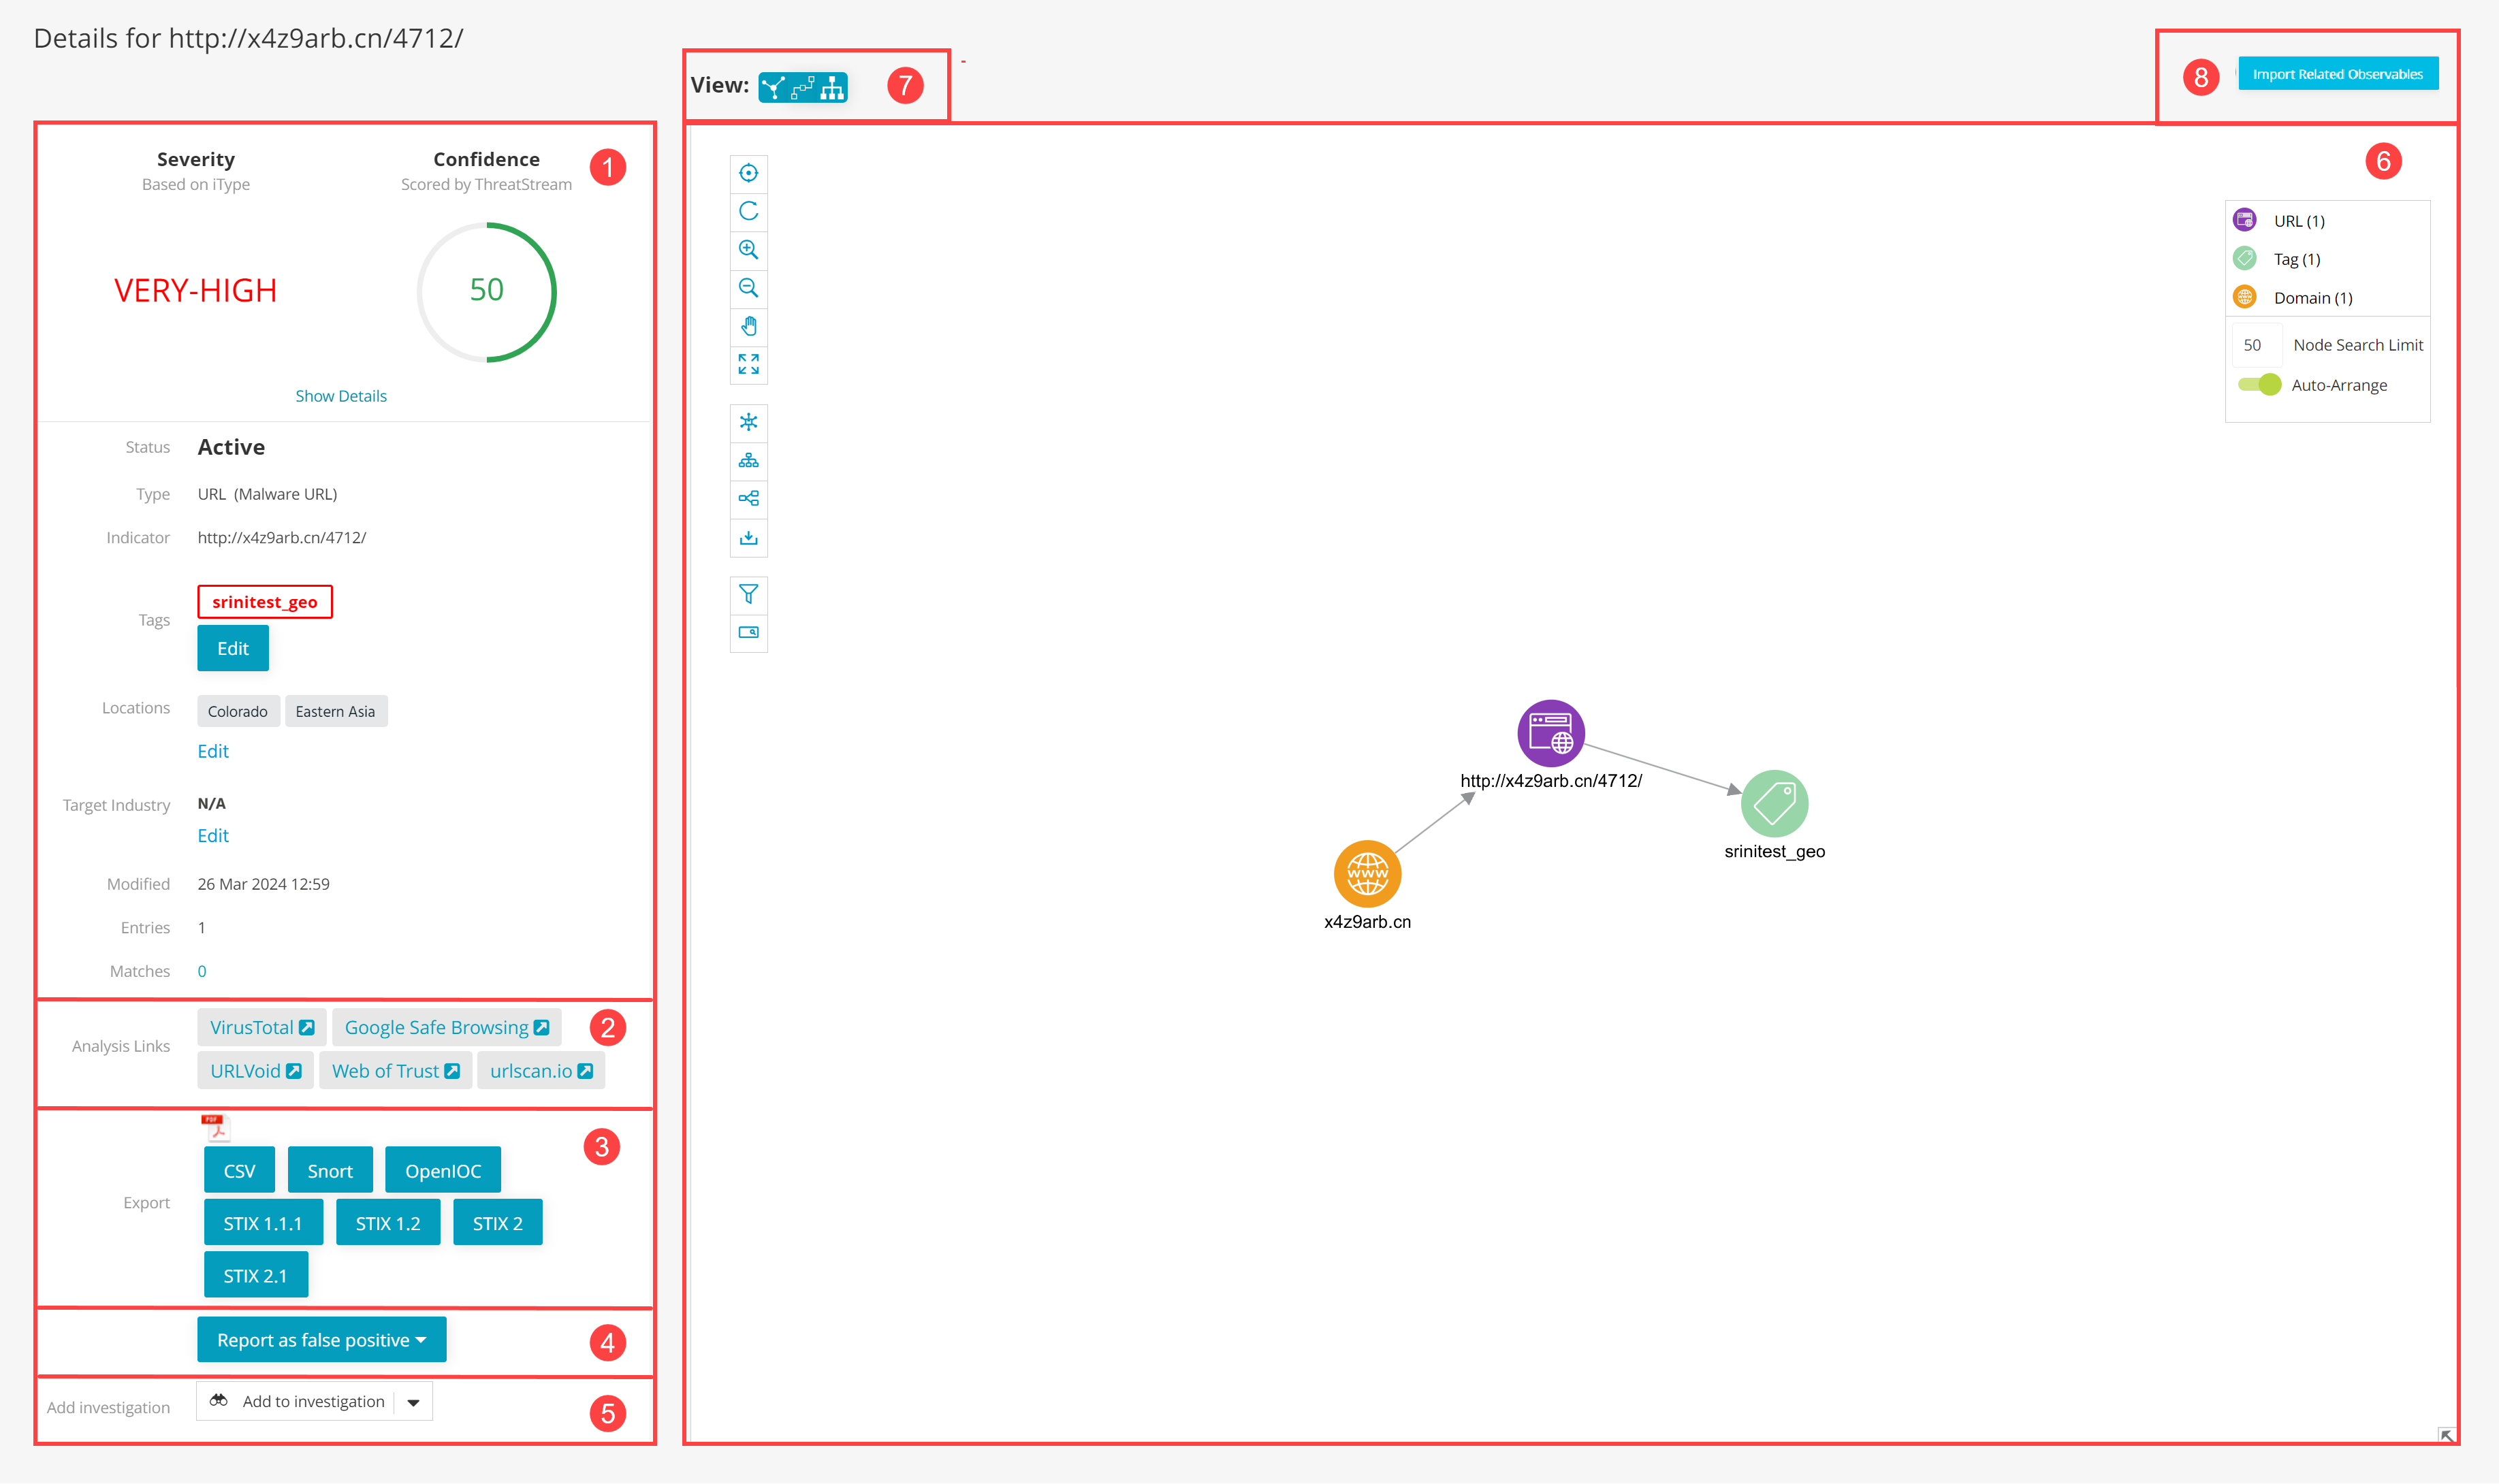
 Observable Details
Note: When details pages aggregate multiple instances of the same observable value, this details in this section correspond to the instance with the highest ThreatStream assigned confidence score in active state.
| Field | Description |
|---|---|
| Severity |
Gauges the potential impact of the indicator type the observable is thought to be associated with. By default, ThreatStream maps observables to one of four severity values based on the indicator type with which they are associated. For example, command and control indicator types are mapped to the severity value High, while TOR related observables are mapped to Low. However, cases occur in which default values are not displayed. In some cases, severity values assigned to observables by the source are used. For a complete list of indicator types and corresponding default severity values, see Indicator Types in ThreatStream. |
| Confidence |
Confidence indicates the certainty that an observable exhibits or is connected to malicious behavior. Anomali ThreatStream's machine learning-based threat intelligence engine calculates confidence by taking many factors into account. Confidence is calculated for all available instances of a single observable as reported by various threat intelligence sources. If the observable details page aggregates multiple instances of the same observable, the highest ThreatStream assigned confidence score of the available instances in active state is displayed. In these cases high (Hi), low (Lo), and an average (Avg) confidence values are displayed when you mouse over the confidence value. For more information on how confidence is calculated and used in ThreatStream, see Observable Confidence in ThreatStream. Org Admins can configure observable details pages to display the Source Reported Confidence instead of confidence values assigned by ThreatStream. For more on confidence value display settings, see Viewing and Editing Organization Settings. |
| Status |
Whether the observable is Active, Inactive, or False Positive. Observables imported through feeds to which ThreatStream assigns a confidence score less than or equal to 15 are automatically marked false positive. Observables imported and approved through the ThreatStream user interface are never automatically marked false positive by ThreatStream. Since an observable can have multiple instances, cases occur in which observable values—imported through a feed—are automatically marked false positive by ThreatStream due to their confidence scores, while identical values—imported and approved through the ThreatStream user interface—have active status. |
| Type |
Indicator type associated with the observable. See Indicator Types in ThreatStream for more information. If the observable details page aggregates multiple instances of the same observable, the indicator type associated with the most recently imported observable is displayed. |
| Tags |
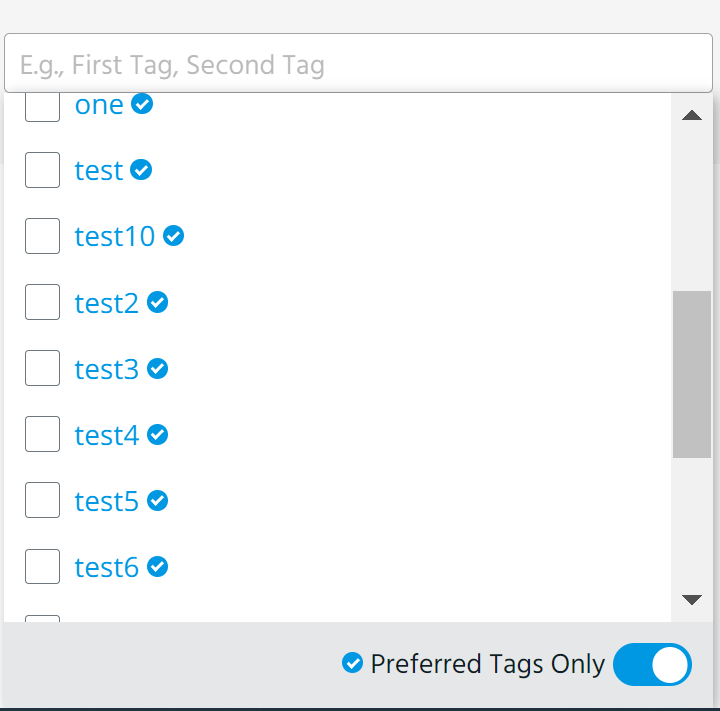
View tags associated with all available instances of the observable. Click Edit to add or remove tags. Click Done to save changes. As you type the first few characters of the tag, the 20 most used tags in your organization from the previous seven days are displayed. Enable the Preferred Tags Only toggle to display and search though only the list of preferred tags. Alternatively, enter * to display preferred tags.
Tags must be 2,000 characters or less. Observables can contain up to 200 tags per organization. Tags added by other organizations do not count toward this limit. To add private tags that are only visible to your organization, assign them the My Organization visibility setting. Tags assigned the Anomali Community visibility setting are visible to any user with access to the observable. See Adding Private Tags to Observables for more information. Since organizations can decide whether users outside of their organization can add public tags to their data, the Anomali Community visibility setting is not available in all cases. In cases where there are multiple instances of an observable, Anomali Community tags will only be added to instances of the observable if owner organizations allow public tags from external users. You can only remove tags that were added by users in your organization. Tip: Did you know that you can add tags to observables in bulk? See Bulk Tag Management of Observables for more information. |
| Source Locations |
Source locations. ThreatStream supports 325 locations (as defined by STIX 2.1) including 27 regions, 247 countries, 50 US States, and Washington DC. Users of the organization that owns the observable can add or delete source locations. To add a new source location associated with the observable:
To remove a source location from the observable:
|
| Target Locations |
Target Locations. ThreatStream supports 325 locations (as defined by STIX 2.1) including 27 regions, 247 countries, 50 US States, and Washington DC. Users of the organization that owns the observable can add or delete target locations. To add a new target location associated with the observable:
To remove a target location from the observable:
|
| Target Industry |
Target industry associated with the observable. Target Industry values are defined by the STIX 2.1 Industry Sector vocabulary. Note: Tag-like Target Industry values assigned to the observables before the implementation of STIX 2.1 support for the Target Industry field are deprecated and no longer available in the ThreatStream UI. To continue filtering and searching for observables based on their target industries, you must assign new target industries to the observables. Also, you must modify your rules and saved searches to use the new Target Industry values.
To add a new target industry:
To remove a target industry:
|
| Modified | Timestamp of the most recent update made to the details of the observable. |
| Entries | Number of instances of the observable to which you have access on ThreatStream. Details of each instance are listed below in the Intelligence section. |
| Matches | Number of times the observable has matched on Security Analytics Cloud. |
| My Attacks | Number of times the observable has appeared in your My Attacks Report from your integration destinations such as Splunk and ArcSight ESM and Security Analytics on-premise. You can click View to manually manage My Attacks data. See Viewing Matches and My Attacks for more information. |
| Country | Two-letter ISO country code for the IP associated with the observable. For example, US, CN, DE, and so on. |
| ASN | The Autonomous System Number (ASN) for the IP associated with the observable. |
| Organization | ThreatStream organization that owns the observable. |
| Insights | Additional context on the observable from external sources. |
 Analysis Links
View external resources for more information on the observable. The table below lists the resources available for each observable type.
| Type | Resource |
|---|---|
| Domain | Google Safe Browsing, URLVoid, VirusTotal, Web of Trust, urlscan.io |
| Hash | VirusTotal |
| IP | Google Safe Browsing, IPVoid, Shodan, VirusTotal, urlscan.io |
| URL | Google Safe Browsing, URLVoid, VirusTotal, Web of Trust, urlscan.io |
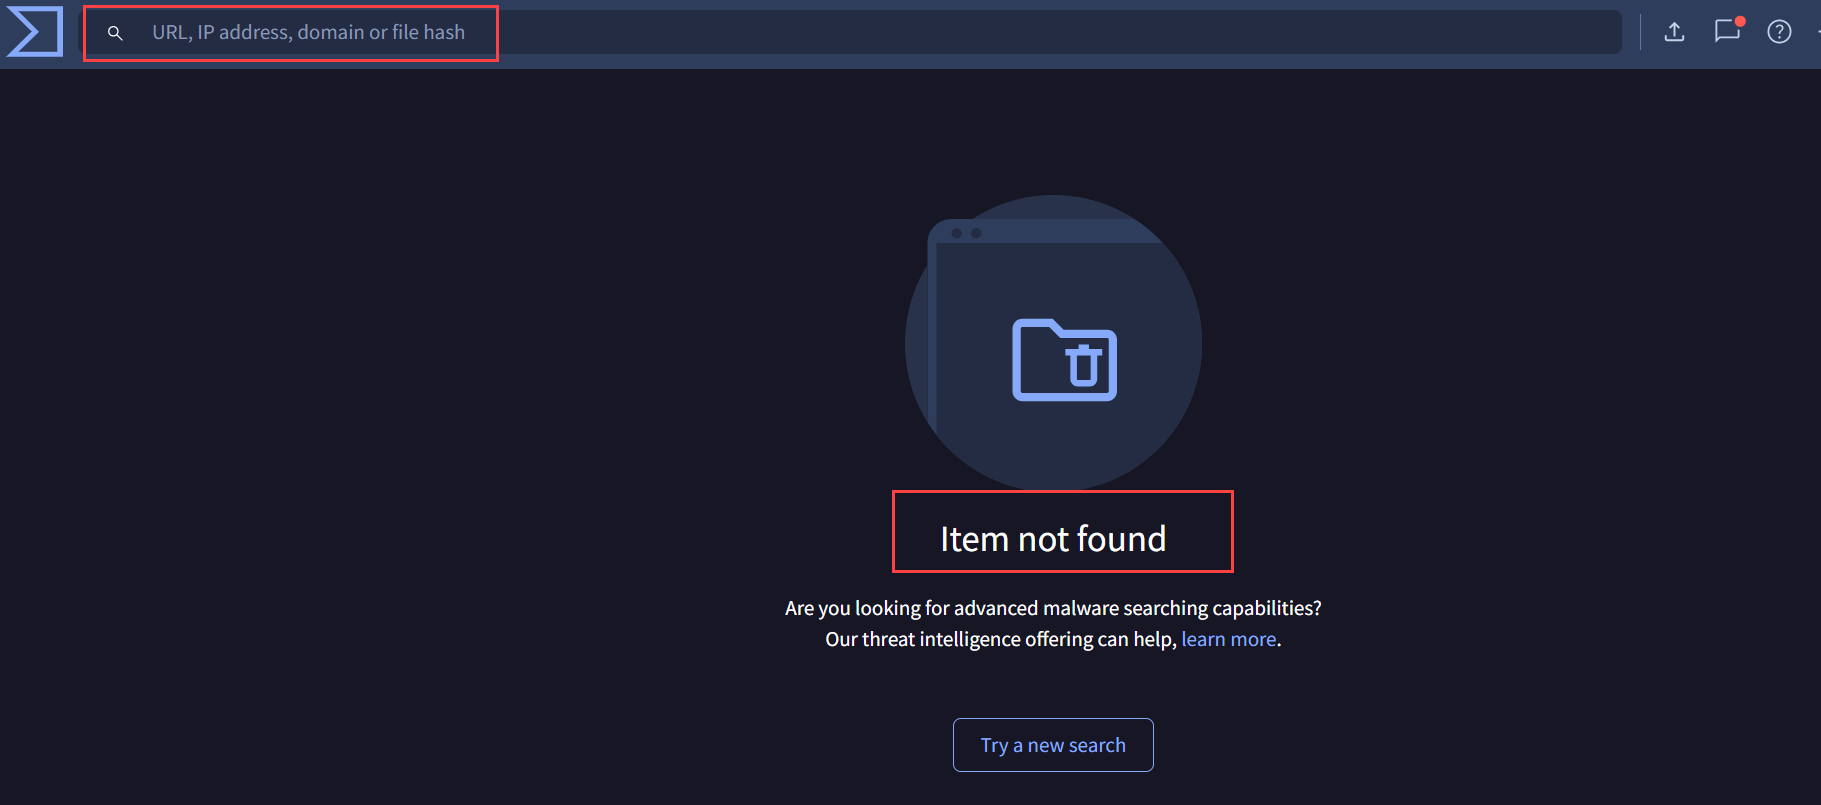
If an observable is not found on a resource’s website, it means the resource does not have this observable in its database yet. In this case, you can try scanning the observable manually on the resource’s website.
Below is an example of the VirusTotal UI showing that the observable is not present in the VirusTotal database. If you want VirusTotal to analyze the observable, copy and paste the observable into the search field for VirusTotal to scan it.
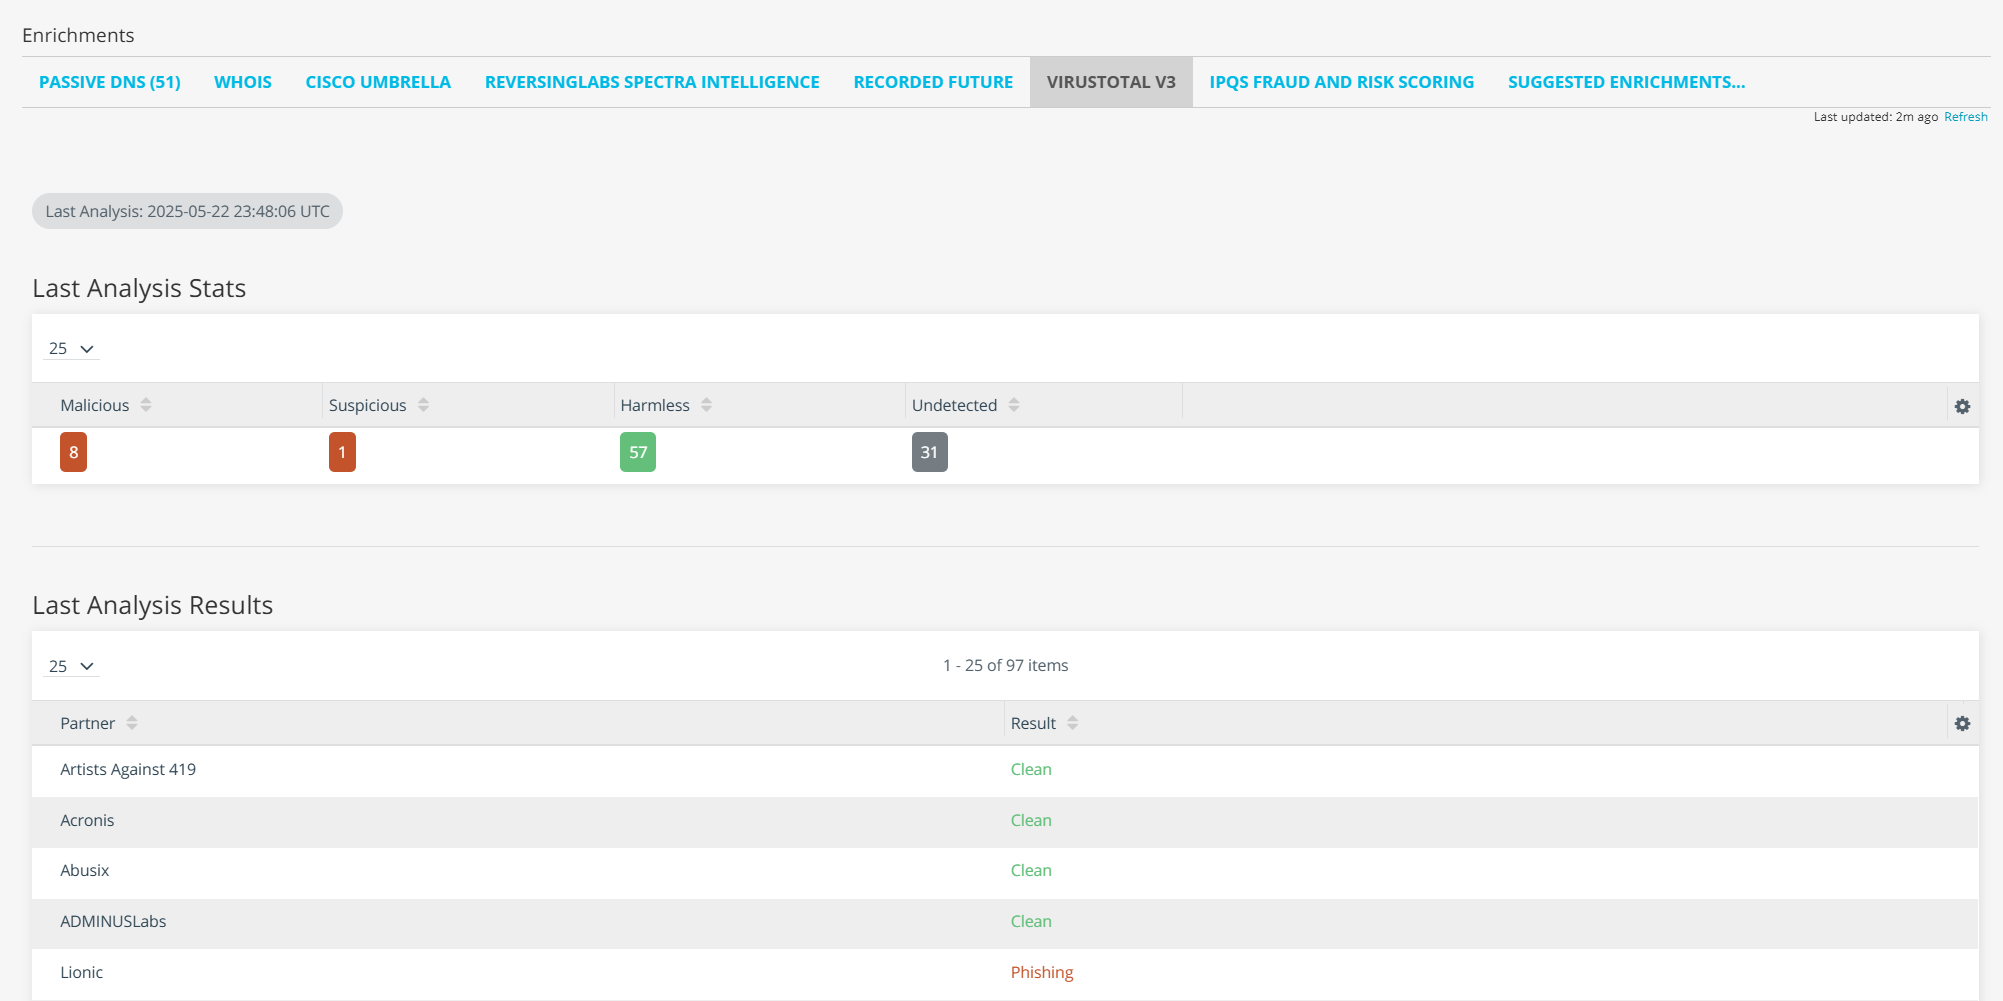
VirusTotal will analyze the observable and provide a detailed report. The latest VirusTotal analysis statistics will also be displayed in the Enrichments section on the observable details page.

See Supported Attributes for Indicators for a list of supported STIX attributes.
Note:
- Tags are included in STIX 1.x exports as Cybox:Keywords. Up to 250 tags can be exported.
-
STIX 2.0 and 2.1 exports are only supported for Domain, Email, Hash, IP address, and URL observables.
-
All timestamps are displayed in UTC when exported.
-
When exporting to STIX, TLP: Clear value is exported as TLP:White, and TLP: Amber+ Strict value is exported as TLP: Red in the generated XML or JSON file.
 False Positive
Report the observable as false positive. See Reporting False Positives for more information.
 Investigation
Add the observable to an investigation. See Investigating Threats in ThreatStream for more information.
 Relationships
View and build graphical representations of relationships between the observable and other observables or Threat Model entities. For more on using the Relationships tool, see Analyzing Adversary Infrastructure with Explore.
Note: On Observable details pages, Explore contains an additional export icon. Clicking this icon exports the graph in PNG format.
Auto-Map to MITRE, a feature available on pivoting tools within investigations, is not available on observable details pages. See Automatically Adding MITRE ATT&CK Techniques to Investigations for more information.

View values for every available intelligence field—in addition to intelligence from enrichments you have access to—in two different views.
- Click
 to view intelligence in a graphical tree.
 - Click
 to view intelligence in a table.
 Import Related Observables
If your organization subscribes to Virus Total, you can import related domains, hashes, and URLs provided by Virus Total at the click of a button.
 Read more...
To import observables from Virus Total:
- Navigate to the observable details page that contains the related Virus Total intelligence you want to import.
- Click Import Related Observables.
-
Select the observables you want to import.
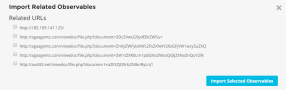
- Click Import Related Observables.
- Complete the import job on the Import screen. Import jobs must be approved before the observables are added to your threat intelligence on ThreatStream.
Note: By default, import jobs for related Virus Total observables assign Visibility, Confidence, Expiration Date, and Threat Type values based on the parent observable.
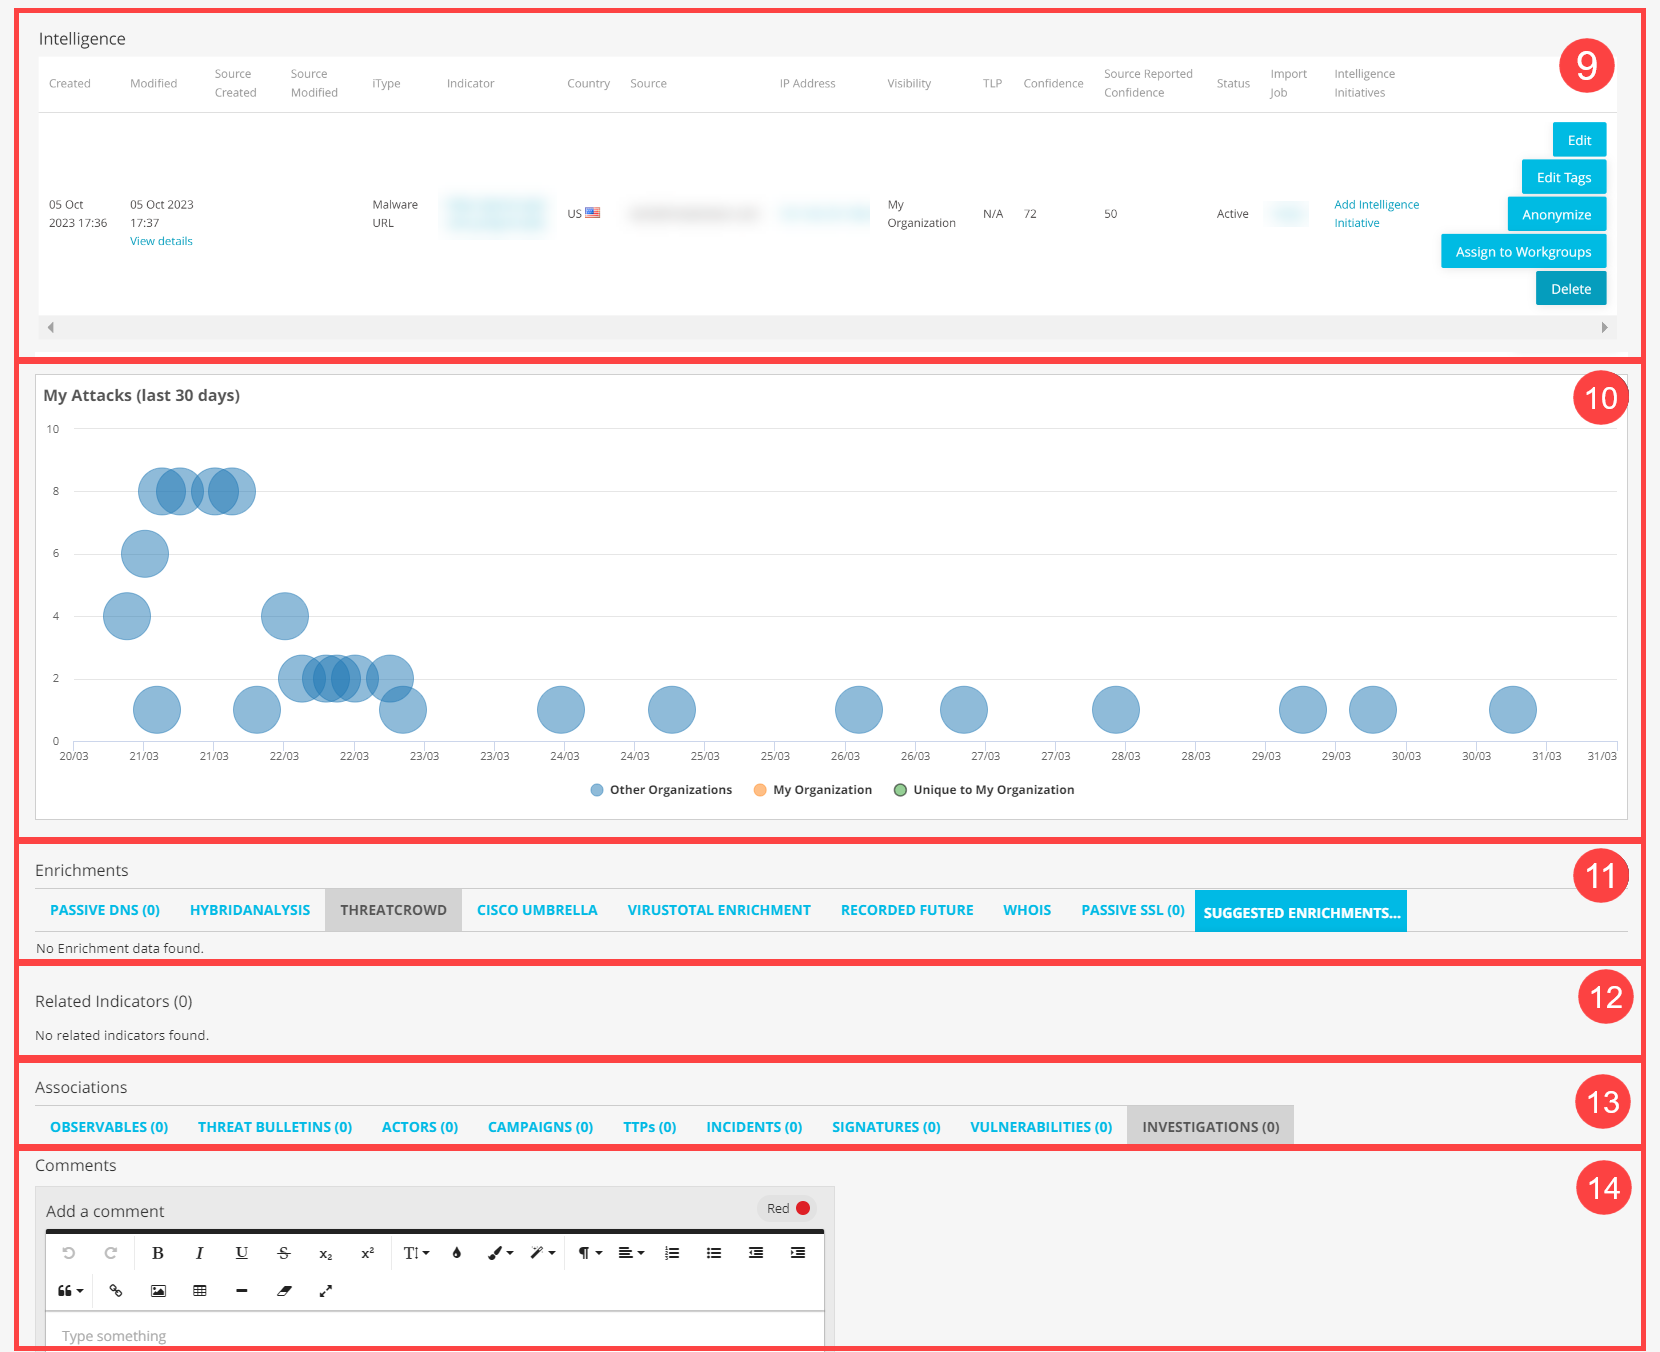

View each available instance of the observable. If encountered by multiple data sources, more than one instance is displayed.
Observables, even with the same value, are considered unique or distinct on ThreatStream if any of the following factors associated with these observables are different:
Observable Type (IP, Domain, URL, Email, Hash)
Feed IDs or source from which the observables were ingested into ThreatStream
Organizations to which they belong on ThreatStream
Therefore, an import operation will allow an import of the observables with the same value if any of the above factors for those observables are distinct. Similarly, the observable details page will show multiple observables with the same value.
| Field | Description |
|---|---|
| Created |
Date the instance of the observable became active in ThreatStream. |
| Modified |
Date the instance of the observable was most recently edited.
|
| Source Created | Timestamp when the observable was created by its original source. |
| Source Modified | Timestamp when the observable was last modified by its original source. |
| iType |
Indicator type associated with the observable. See Indicator Types in ThreatStream for more information. |
| Indicator | Value of the observable. |
| Country | Country associated with the observable. |
| Source | Feed, trusted circle, or organization user from which the instance originates. |
| Visibility | Visibility setting for the instance Anomali Community, Trusted Circles, or My Organization. The visibility of observables imported by your organization can be further restricted to specific workgroups in your organization. See Restricting Observable Visibility to Workgroups for more information. |
| TLP |
TLP (Traffic Light Protocol) color assigned to the instance. The TLP color provides a mechanism to communicate to consumers of the information whether further dissemination of this information is allowed; if yes, how freely can this information be distributed. To learn more about TLP, search for "Traffic Light Protocol" in your favorite search engine. |
| Confidence | Confidence values assigned to the observable instance by ThreatStream. These confidence values are determined either in part or in whole by Anomali’s machine learning algorithms. Anomali’s algorithms take many factors into account when calculating confidence scores. See ThreatStream Assigned Confidence for more information. |
| Source Reported Confidence |
Confidence value assigned to an observable by its source. As data originates from an array of sources, Source Reported Confidence values can be assigned by premium feed providers, open source feeds, or individual analysts manually importing data - among others. ThreatStream ingests Source Reported Confidence scores and displays them to users as-is, without alteration. See Source Reported Confidence for more information. |
| Status | Current status of the instance—Active, Inactive, or False Positive. |
| Import Job |
Link to the import job associated with the instance. |
| Intelligence Initiatives | Intelligence Initiatives associated with the observable. To add the observable to an intelligence initiative, click Add Intelligence Initiative. |
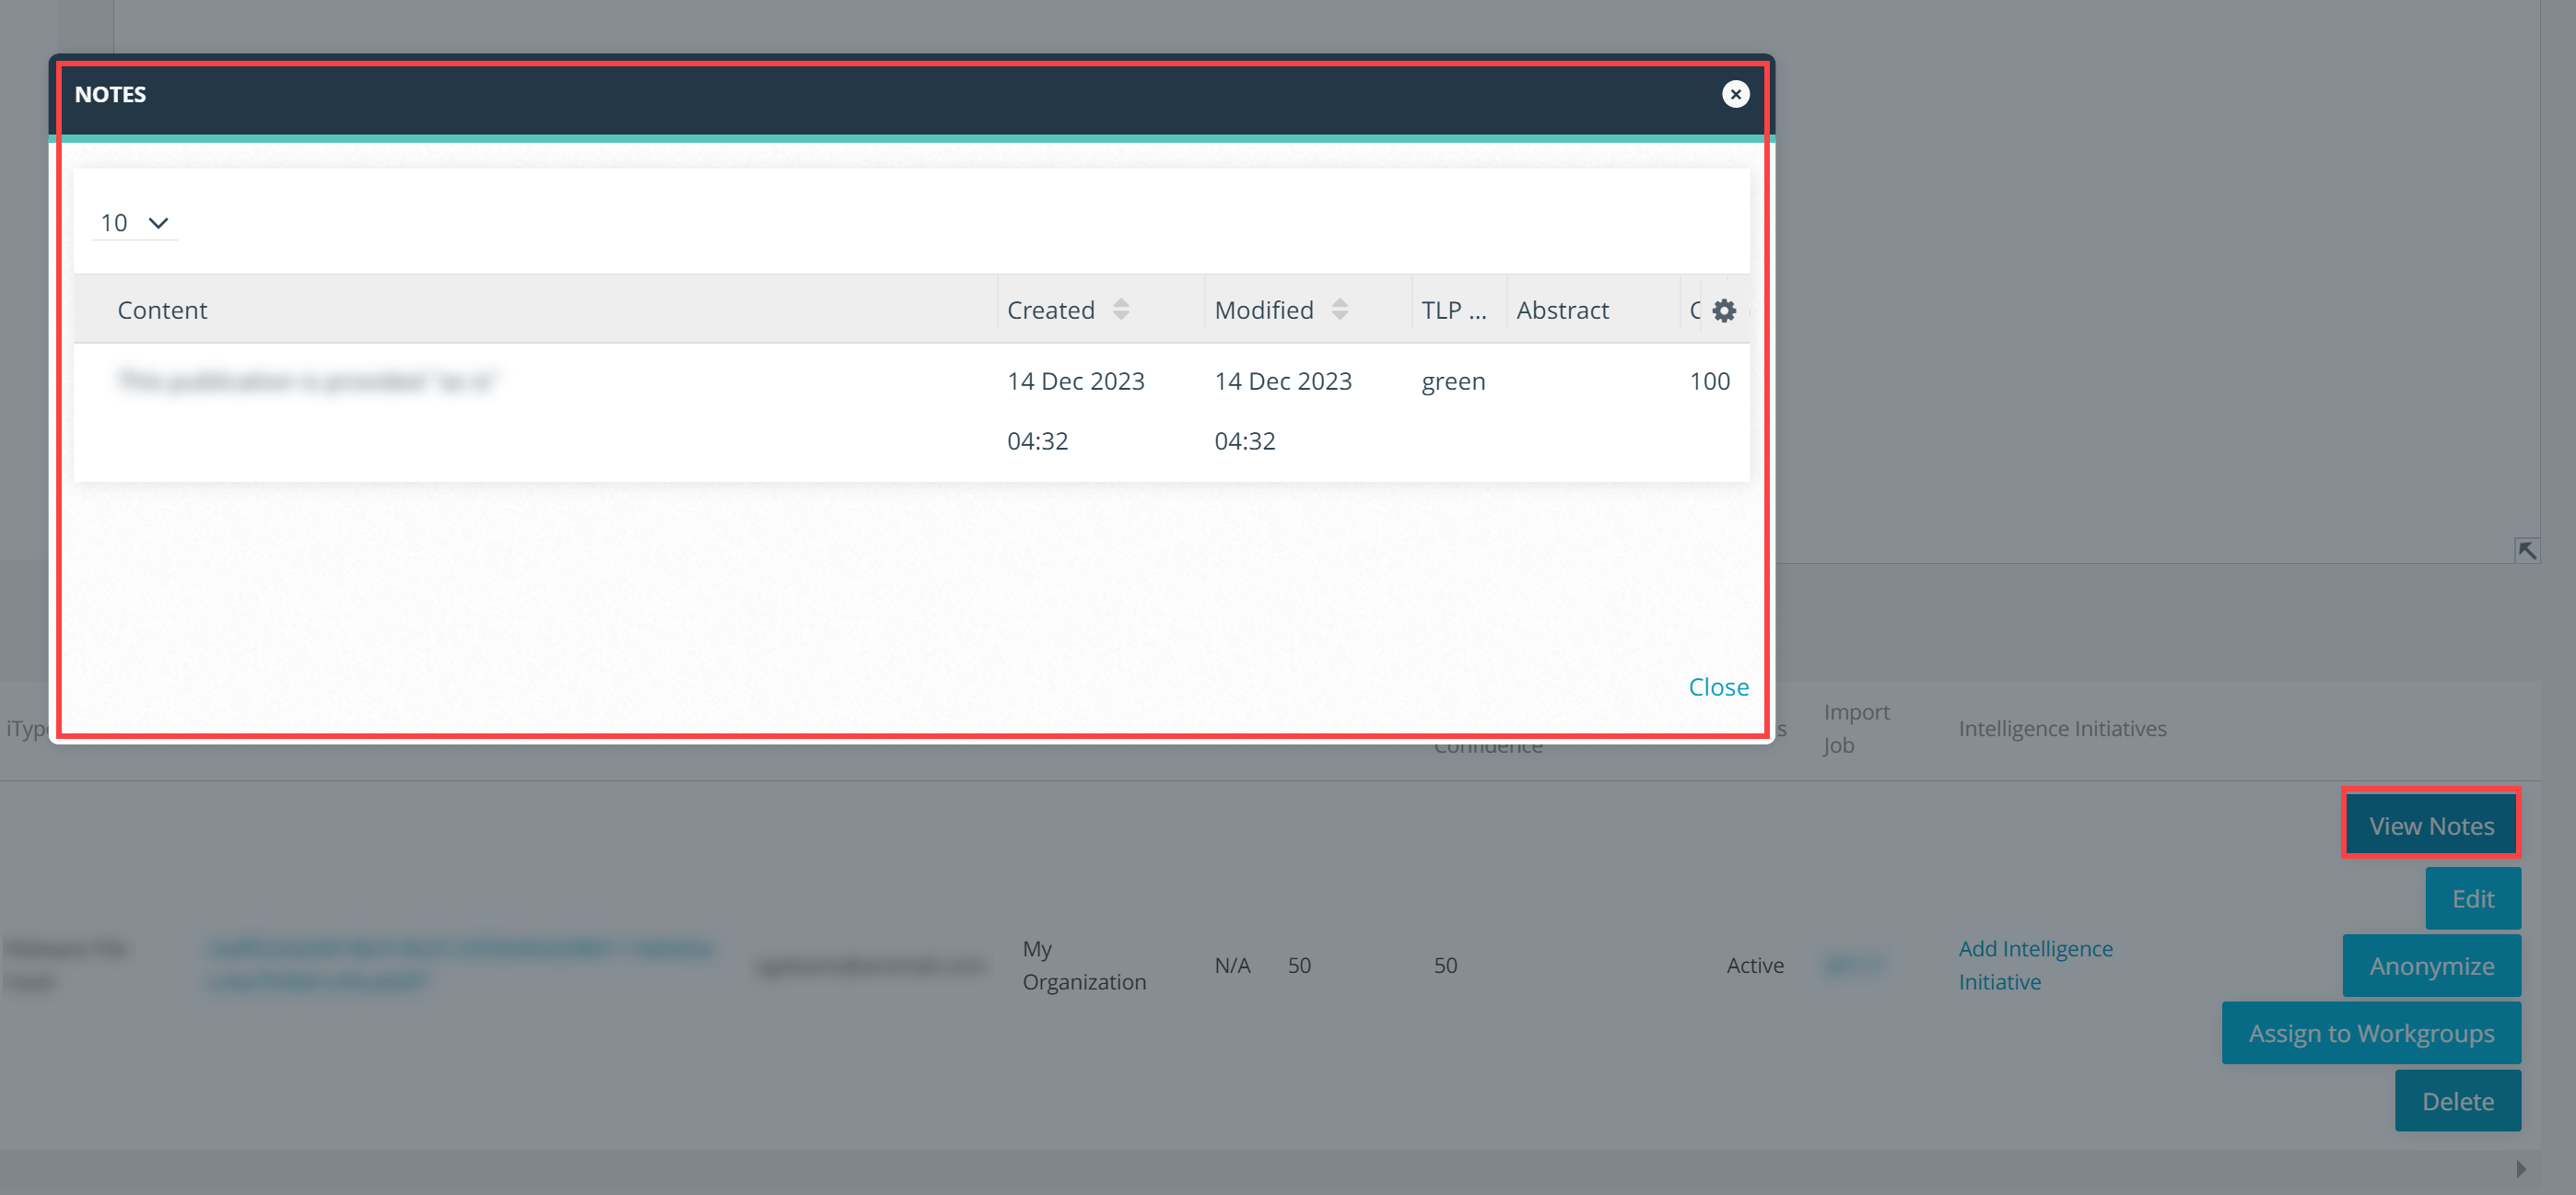
If an observable is a STIX 2.1 indicator imported via STIX import or TAXII integration, the View Notes button is displayed. See Importing STIX Data into the Anomali Threat Model for details.
Click View Notes to view the list of notes associated with the observable.
If you have permission to clone an observable, the Clone button is displayed. See Cloning Observables for more information.
If you have permission to edit observables, the Edit button is displayed. See Editing Observable Details for more information.
If an observable belongs to your organization, the Anonymize button is displayed. You can use it to change the user and organization information anonymization setting for the instance. If enabled, users outside of your organization with access to the data will see "Analyst" in all fields that would otherwise display an organization or user name.
If an observable visibility is set to My Organization, the Assign to Workgroup button is displayed. Click it if you want to restrict the visibility of the observable to specific workgroups within your organization. See Restricting Observable Visibility to Workgroups for more information.
 My Attacks
View attack data on the observable in a graphical widget. My Attacks is only displayed if My Recent Attacks data is available for the observable. For more on My Attacks, see Viewing Matches and My Attacks.
 Enrichments
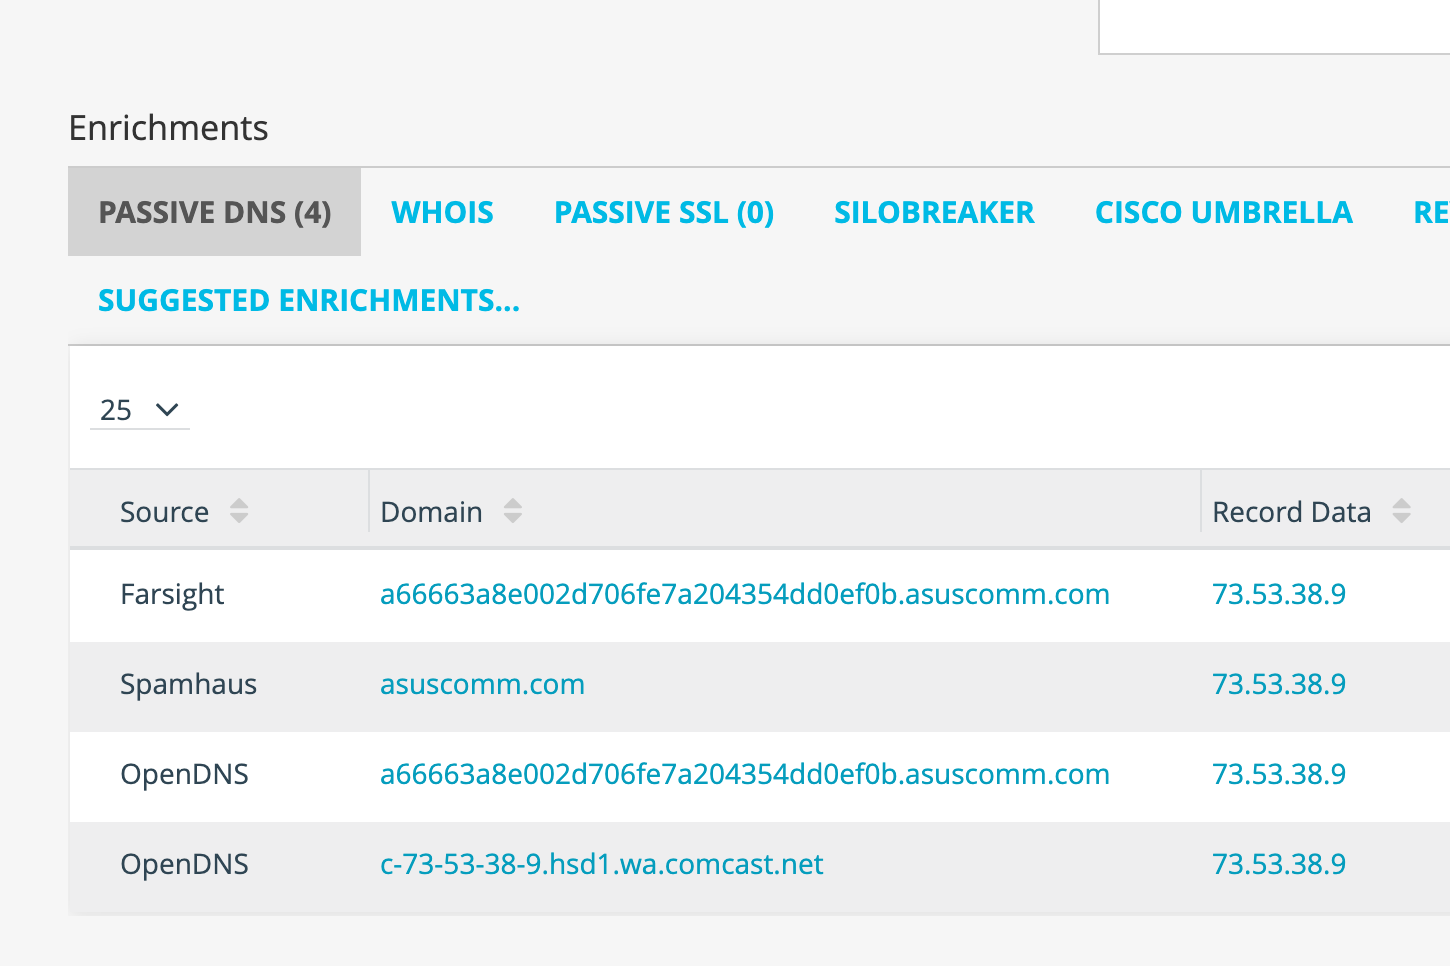
View various data enrichments on the observable from external sources. Click Refresh to retrieve the latest data of the selected enrichment. Click Suggested Enrichments... to view a list of available unactivated enrichments that ThreatStream recommends for the observable based on its indicator type. Clicking an unactivated enrichment takes you to the APP Store, where you can activate the enrichment. For more information on available enrichments, see Activating Enrichments.
The Passive DNS tab displays data from Passive DNS services. Data from the Spamhaus Passive DNS service is available out of the box. To view data from other Passive DNS services available on ThreatStream, you must activate them via the Integrations tab in ThreatStream Settings or in the App Store.
 Related Indicators
If available, related observables from Virus Total are displayed. You can import these observables by clicking Import Related Observables at the top of the screen.
 Associations
View and drill down on observables, threat model entities, and investigations associated with the observable.
 Comments
View and add comments to the observable. To add private comments visible to your organization only, assign the Red color to them. Comments with the White color assigned to them are visible to any user with access to the observable. If the White color is not available, your Org Admin has enabled the Restrict Public Comments setting to restrict users in your organization from posting public comments. This is done to prevent your organization’s comments from being shared publicly.