Viewing Matches and My Attacks
The Matches and My Attacks information (previously known as Sightings) provides a comprehensive view of the detections received from your infrastructure. These detections are received from your Anomali Security Analytics instance or your Anomali Match on-premise, and the integration destinations such as ArcSight ESM, LogRhythm, QRadar, and Splunk in your infrastructure.
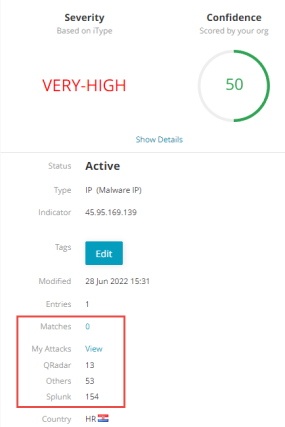
This information is available from the links on the observable details page (See Observables), as shown in the following figure. Up to the previous 180 days of data on the observable is shown.
Matches
The Matches link is a drill-down to the Forensics and Retrospective Searches dashboard of Security Analytics that lists the observable matches found on Security Analytics. By default, matches from the last 6 months are shown. For more information about matches displayed on this dashboard, see Matches on Security Analytics Cloud. This link works only if you have an Security Analytics Cloud account.
The Security Analytics on-premise data is available through the My Attacks - View link.
My Attacks
My Attacks lists detections received from Anomali Match on-premise and other integration destinations. You must configure these sources to send data to ThreatStream. Once received, data is displayed by the type of source on the observable details page (See Observables).
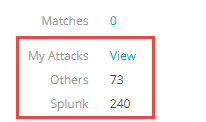
In the above figure, 240 matches to this observable were received from Splunk and 70 were received from other sources.
My Attacks data is provided to ThreatStream by a My Attacks Report. See My Attacks Report for more information. You can also manually add My Attacks data for an observable.
The My Attacks graphical widget, available on the observable details page, enables you to gain a clearer understanding of the observables impacting your infrastructure and how they compare with other organizations in ThreatStream.
The widget displays up to the previous 30 days of data on the observable.
Note: The My Attacks widget is only displayed for observables that appear in the My Recent Attacks widget on the Overview Dashboard.
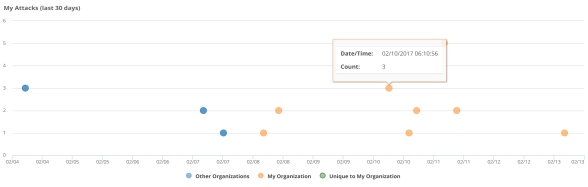
Observable matches displayed in My Attacks are sorted into three categories:
-
Other Organizations: observable matches reported by other ThreatStream organizations and not your organization. Data from other organizations is anonymous and stripped of any personally identifiable information.
- My Organization: observable matches reported by your organization and other ThreatStream organizations.
- Unique to my Organization: observable matches reported only by your organization.
Sending Detections to ThreatStream
My Attacks uses data sent to ThreatStream from Security Analytics and your integration destinations. To enable ThreatStream to receive this data, the following settings must be configured on your integration destinations:
- For ArcSight ESM, LogRhythm, and QRadar, the Enable My Attacks setting must be configured on ThreatStream Integrator. Refer to the ThreatStream Integrator Installation Guide for more information.
- For Splunk users that receive data from ThreatStream through ThreatStream Integrator, the ThreatStream Autotune Report must be enabled on Splunk. Refer to the ThreatStream Splunk App User Guide for more information.
- For Splunk users that receive data directly from ThreatStream, no further configuration is required—the ThreatStream Autotune Report is enabled by default.
- For Match on-premise, configure the My Attacks setting to send observable matches to ThreatStream.
- For Security Analytics, you do not need to do anything. ThreatStream collects this data automatically for your organization through an API call to your Security Analytics instance.
Managing My Attacks Data
In addition to the automated population of My Attacks data through ThreatStream Integrator, My Attacks data can be manually managed from the ThreatStream user interface. You can view, add, edit, and remove My Attacks from observable details pages. All updates you make to your My Attacks data are reflected on the My Attacks widget.
To view My Attacks:
- Navigate to the details page of the observable for which you want to view My Attacks.
-
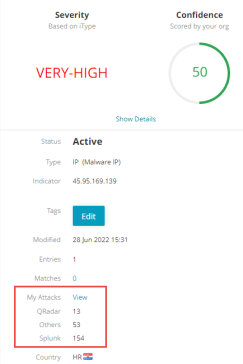
In the Observable Details section of the page, the indented list below My Attacks shows the breakdown of matches received from various sources.
-
Click View next to My Attacks to see the list of matches and other details.
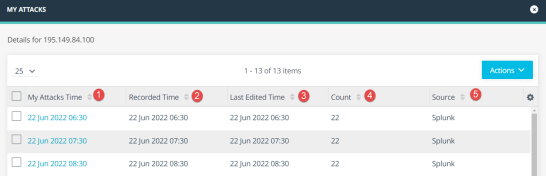
 My Attacks Time: The timestamp for when My Attacks information was received.
 Recorded Time: The timestamp for when My Attacks information was recorded.
 Last Edited Time: The timestamp for when this information was last edited.
 Count: Total number of matches that were received.
 Source: Source such as Splunk and ArcSight ESM from which the My Attacks information was received.
To add My Attacks:
- Navigate to the details page of the observable for which you want to add My Attacks.
-
In the Observable Details section of the page, click View next to My Attacks.
-
In the Actions menu, click Add My Attacks.
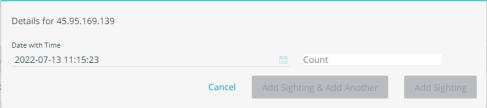
- Select the date and time of the appearance of the observable in your network history.
- Enter a Count—number of instances of the observable during the Incident.
-
Click Add My Attacks to add the observable and close the window.
OR
Click Add My Attacks & Add Another to add the observable and continue creating additional observables.
To edit My Attacks:
- Navigate to the details page of the observable for which you want to edit My Attacks.
- In the Observable Details section of the page, click View next to My Attacks.
- Locate the My Attacks information you want to edit and click its My Attacks Time.
- Make required edits and click Save Change.
To delete My Attacks:
- Navigate to the details page of the observable for which you want to delete My Attacks.
- In the Observable Details section of the page, click View next to My Attacks.
- Select the My Attacks which you want to delete and click Remove in the Actions menu.