Analyzing Adversary Infrastructure with Explore
Explore is a graphical tool that enables you to build out comprehensive maps of adversary attack infrastructure. Starting from a single observable, you can ripple outward to create a visual representation of relationships with data that is known to be related, such as Actors, other observables, and so on. With Explore, you can view relationships between observables without having to manually cross reference dozens of details pages.
In addition to searching ThreatStream intelligence, you can search the Passive DNS and Whois databases from within ThreatStream.
Further, with the Passive SSL integration provided by ThreatStream, you can use Explore to perform new research on adversaries and map out previously unknown infrastructure.
 Read more...
Exploring Known Attack Infrastructure
Explore enables you map out attack infrastructure that is known to be related to the observable by querying data that already exists in ThreatStream. Data from ThreatStream that you can query from Explore includes associated observables, Actors, Campaigns, Incidents, TTPs, Threat Bulletins, and Vulnerabilities. For example, you could query Actors on the observable and Explore would add any Actors associated with the observable in the Anomali threat model to the chart.
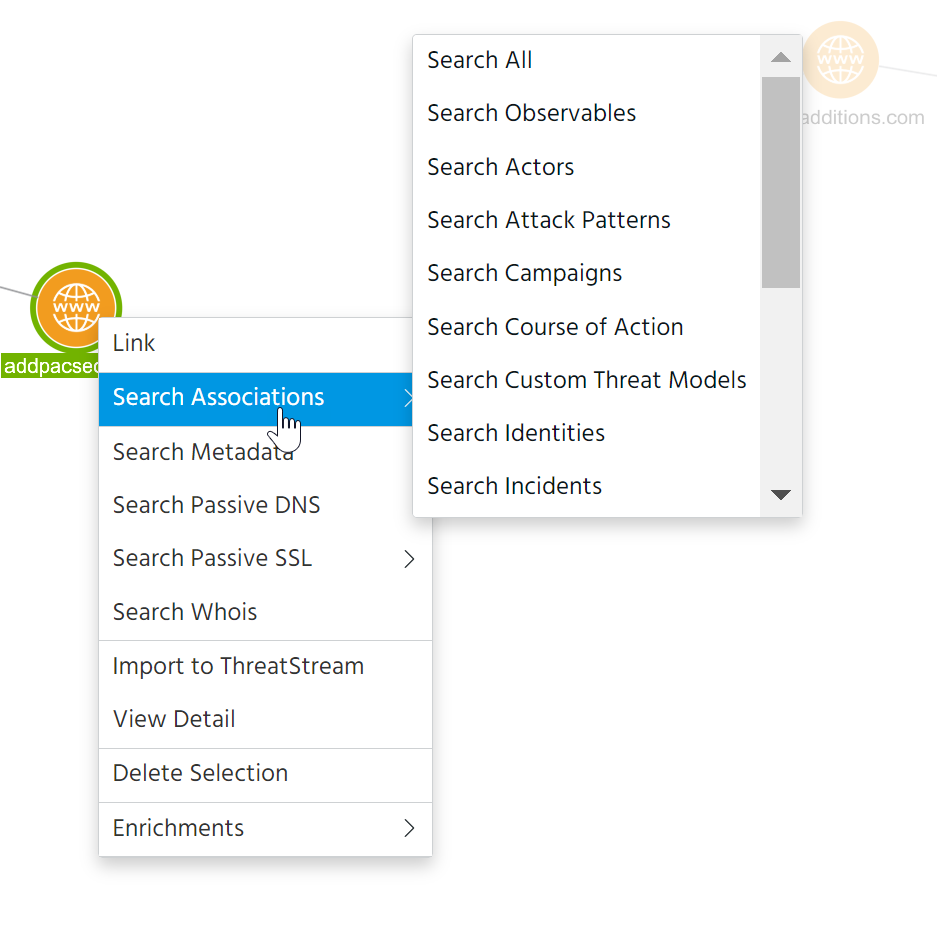
Additionally, for domain observables, you can run Passive DNS searches to return associated IP addresses and Whois searches to return associated email addresses.
Exploring Previously Unknown Attack Infrastructure
With the third party integrations provided by ThreatStream, you can use Explore to perform new research and build out previously unknown adversary attack infrastructure. ThreatStream's Passive SSL integration enables you to perform Related Certificates, Certificate to IP, and Certificate to Domain searches on observables. In doing so, you can make connections between known indicators of compromise and related observables that were previously unknown.
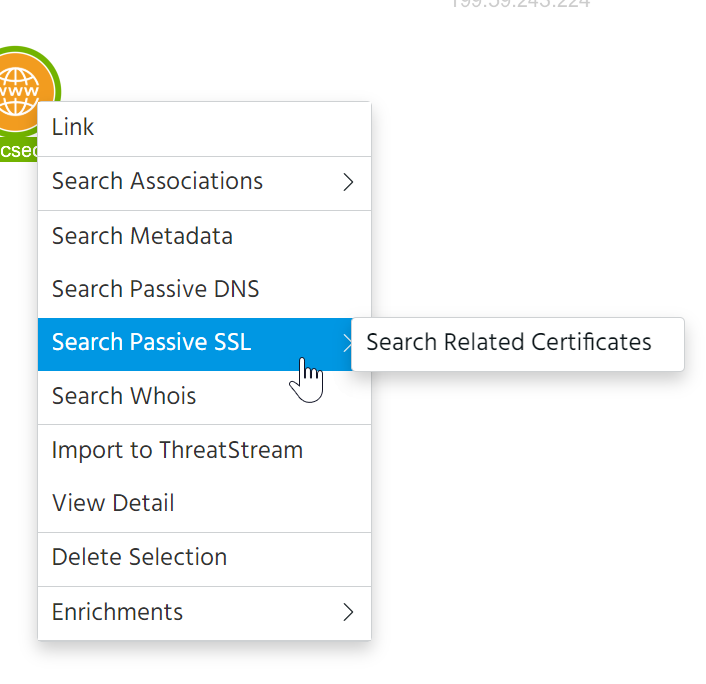
For example, a domain—freesmartphone.net—was discovered when detonating the contents of a phishing email in the sandbox. Using Explore, you can search attack infrastructure unknown to ThreatStream by running Search Related Certificates return all certificates related to the domain.
You can run a Certificate to Domain search on the certificate to return associated domains, or a Certificate to IP search to return associated IP addresses. These observables, potentially part of an adversary attack infrastructure, can be imported to ThreatStream from the Explore interface. The ThreatStream machine learning algorithms will automatically filter out any observables found to be benign. After import, the observables are now available on ThreatStream and can be leveraged by your security tools against the adversary.
Understanding the Explore Interface
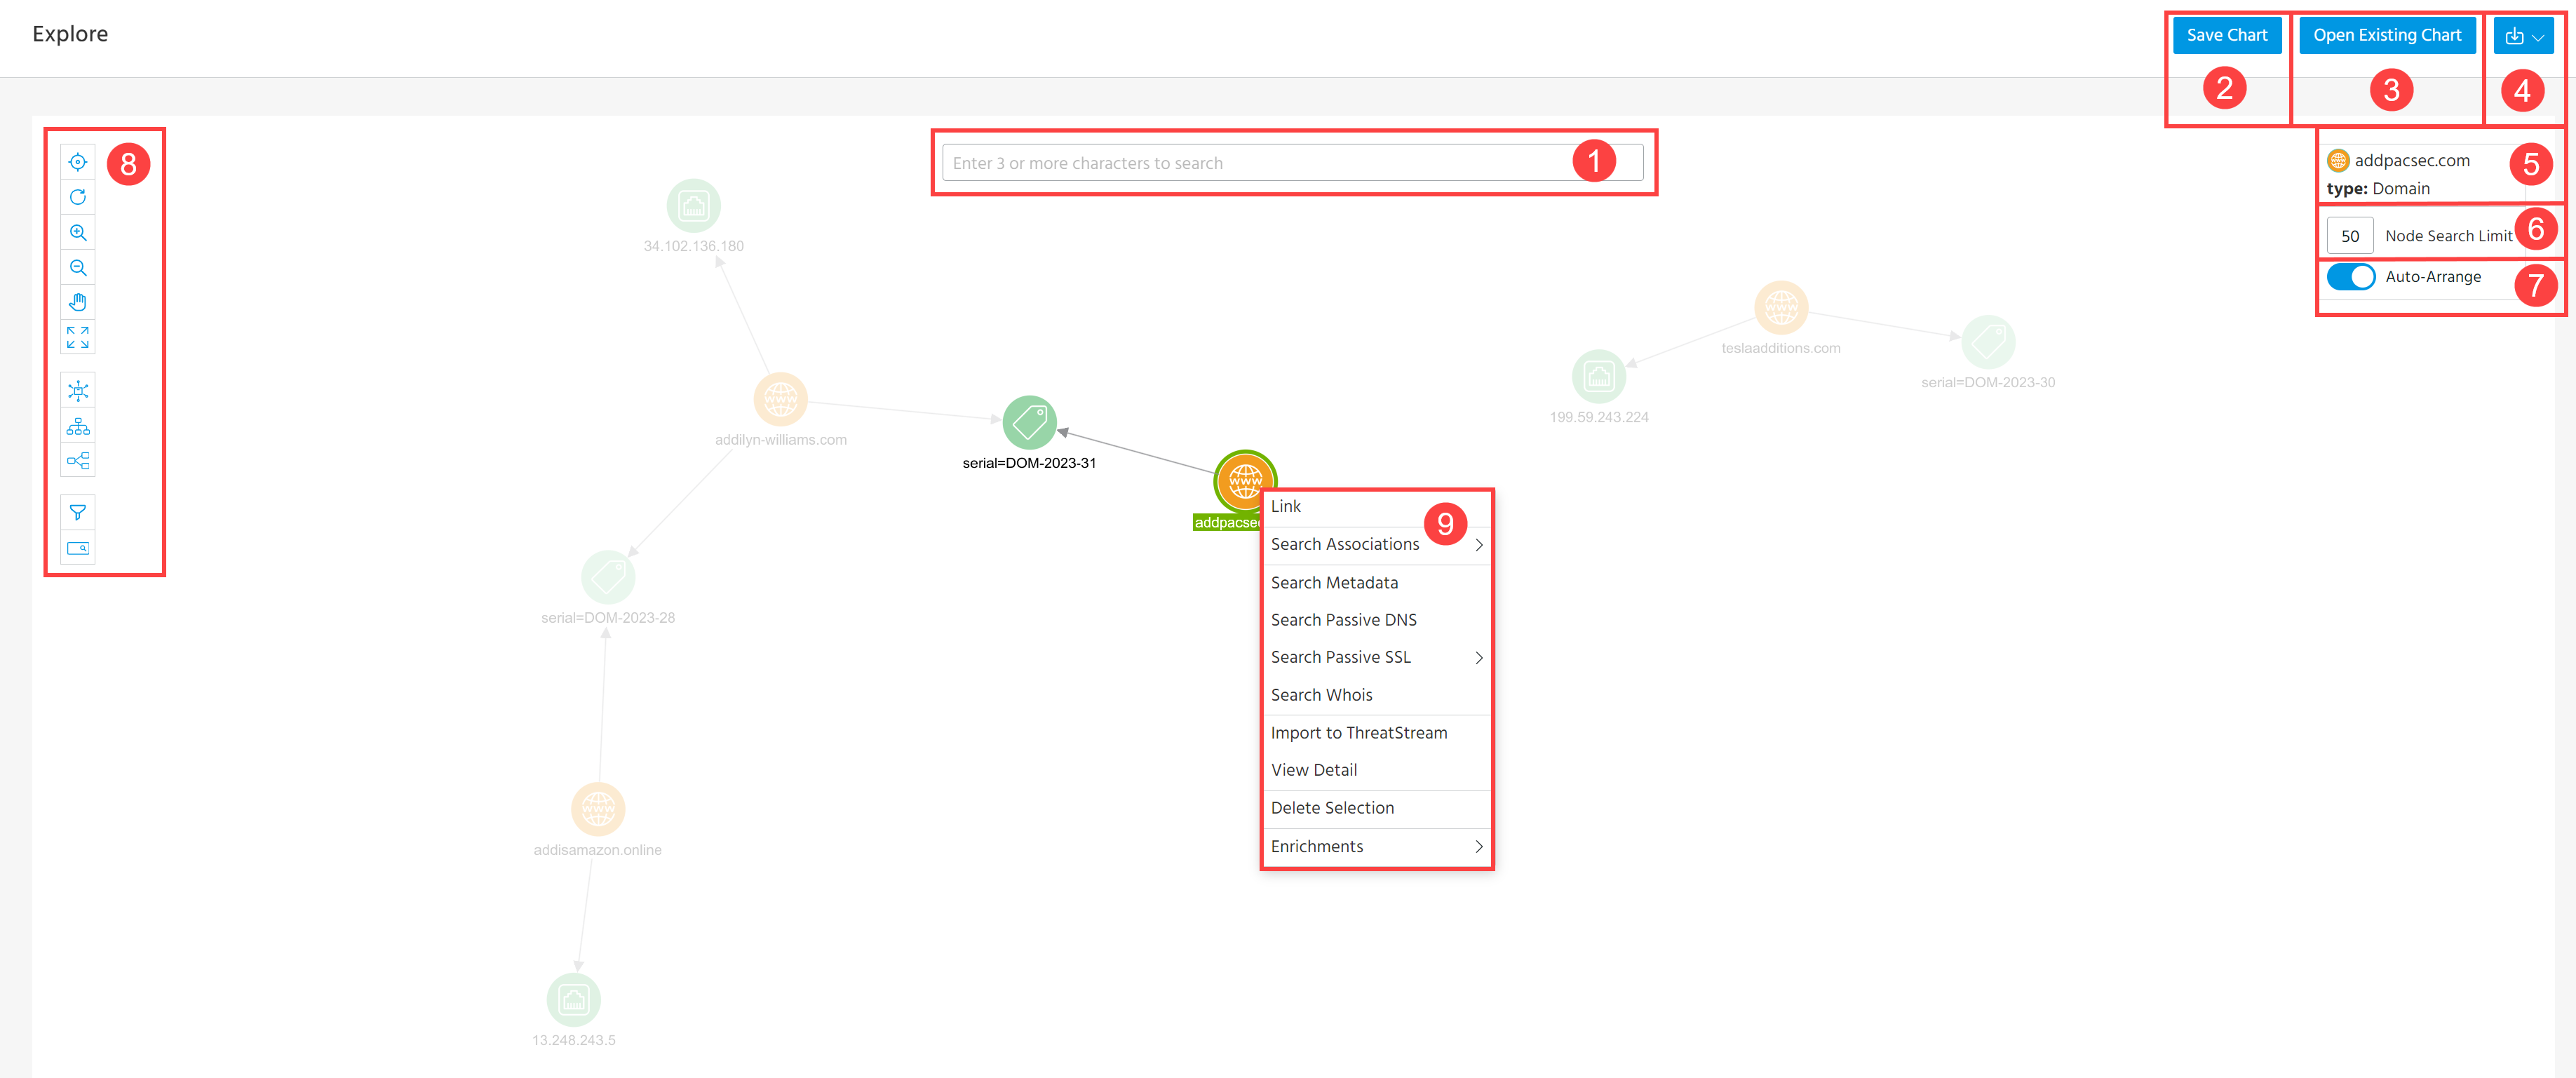
 Search: Search for observables or add text strings to the chart. See Adding Nodes to Explore for more information.
 Save Chart: Save the chart as a file on your local disk. See Saving Explore Chart for more information.
 Open Existing Chart: Load existing charts from previously saved chart files.
 Export: Export the chart in CSV or PNG format. See Exporting Explore Chart for more information.
 Key: View node-types represented on the chart. You can select all nodes of a type by clicking the type on the key. When you select nodes on the Explore chart, node values are displayed in the key.
 Node Search Limit: Sets the maximum number of nodes that can be added to the chart for a single search. The maximum you can enter is 999.
 Auto-Arrange: When enabled, Explore automatically arranges nodes according to the view you have selected when added to the chart. When disabled, nodes remain static when additional nodes are added.
Note: Auto-Map to MITRE, a feature available on pivoting tools within investigations, is not available on the standalone Explore pivoting tool. See Automatically Adding MITRE ATT&CK Techniques to Investigations for more information.
 Chart Options:
- Center the chart.
- Reset the chart. This removes all nodes from the chart.
-
Zoom in or out on the chart.
Tip: You can zoom using your mouse wheel by clicking inside the chart and holding the control key on your keyboard. Zoom centers on specific nodes when you select nodes and zoom in or out.
- Toggle the pointer between move and select modes. Move enables you to click and drag the entire chart around the workspace; select enables you to click and select individual node or click and drag to select multiple nodes.
- Toggle full screen view.
- Toggle between standard, hierarchical, and structural views.
- Show or hide the Explore key.
- Search nodes on the chart by value. Nodes matching the search query you enter are selected on the chart.
 Actions:
-
Link: Create a link between the selected node and another node. To create a link, select a node, click Link, and select the node with which you want to link the initial node.
Links can be removed by clicking the link and then pressing the Delete (for Windows) or FN+Delete (for Mac) keys on your keyboard.
- Search Associations: Search Observables and Threat Model entities that are associated with the selected entity in ThreatStream. Related entities are added to the chart.
- Search Metadata: Add any ASNs, tags, or other metadata associated with the selected entity to the chart.
- Search Passive DNS: Search Passive DNS threat intelligence data for observables related to the selected nodes. Related observables are added to the chart.
- Search Passive SSL: Search Passive SSL data for certificate information. The following Passive SSL searches are available:
Search Related Certificates: Search for related certificates based on certificate text strings. When you run Search Related Certificates, you must select the certificate text of interest.
- Certificate to IP: Search IP addresses associated with selected certificates.
Certificate to Domain: Search domains associated with selected certificates.
- Search Whois: Search Whois threat intelligence data for observables related to the selected nodes.
- Import to ThreatStream: Import selected observables into ThreatStream. Clicking this action will take you to the Import page. See Importing Observables From Explore Chart for more information.
- Group/Ungroup: Group together selected nodes. You can also ungroup grouped nodes by selecting them and clicking Ungroup.
- View Detail: Drill down on the details page in ThreatStream for the selected node.
- Delete Selection: Delete the selected node from the chart.
-
Enrichments: Pivot on the node using enrichments which you have activated on ThreatStream.
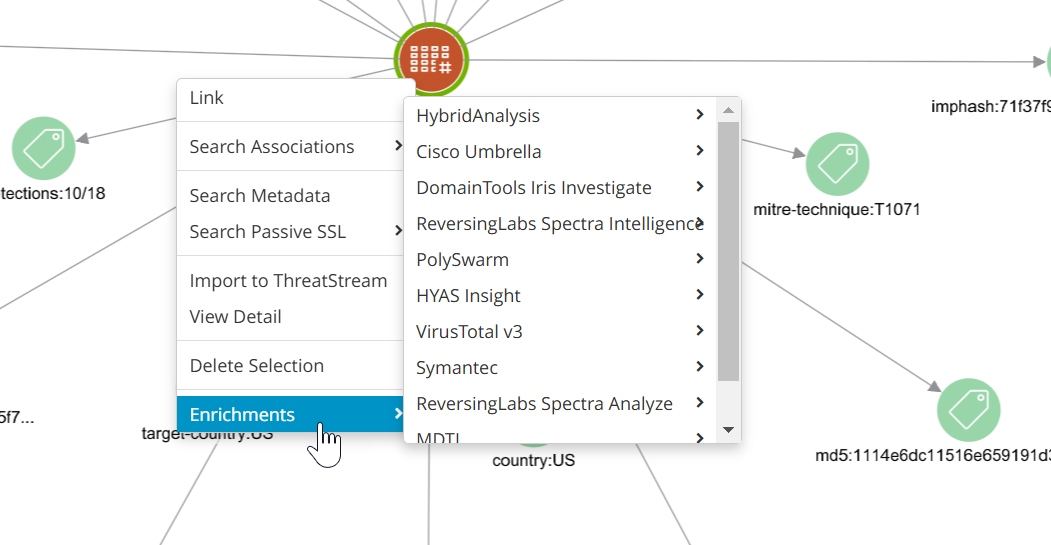
Click Suggested Enrichments... to view a list of unactivated enrichments. Clicking an unactivated enrichment takes you to the APP Store where you can activate the enrichment. For more information on available enrichments, see Subscribing to Anomali Feeds, Enrichments, and Intelligence Channels for more information.
Note: The Enrichments menu is not available when nodes of more than one type are selected.
Adding Nodes to Explore
Explore provides a full text keyword search for adding observables to the chart.
You can also add strings of text to the chart by entering the string and clicking +. This can be helpful in cases where you want to run an ad-hoc intelligence search on a string of interest or an observable that has not been imported.