ThreatStream My Events Dashboard
The ThreatStream My Events dashboard is an interactive tool that enables you to visualize the geographic location of threats around the world. Though not a live view, the dashboard replays the most recent intelligence available to you on ThreatStream. When opened, the map queries the most recent 1000 observables.
To access the ThreatStream My Events dashboard, navigate to Dashboard > Library and locate the ThreatStream My Events dashboard using the Search field.
To access the ThreatStream My Events dashboard in the classic UI:
-
Navigate to Dashboard > Library.
-
Click the ThreatStream Dashboards folder.
-
Click ThreatStream Actors by Region and Industry.
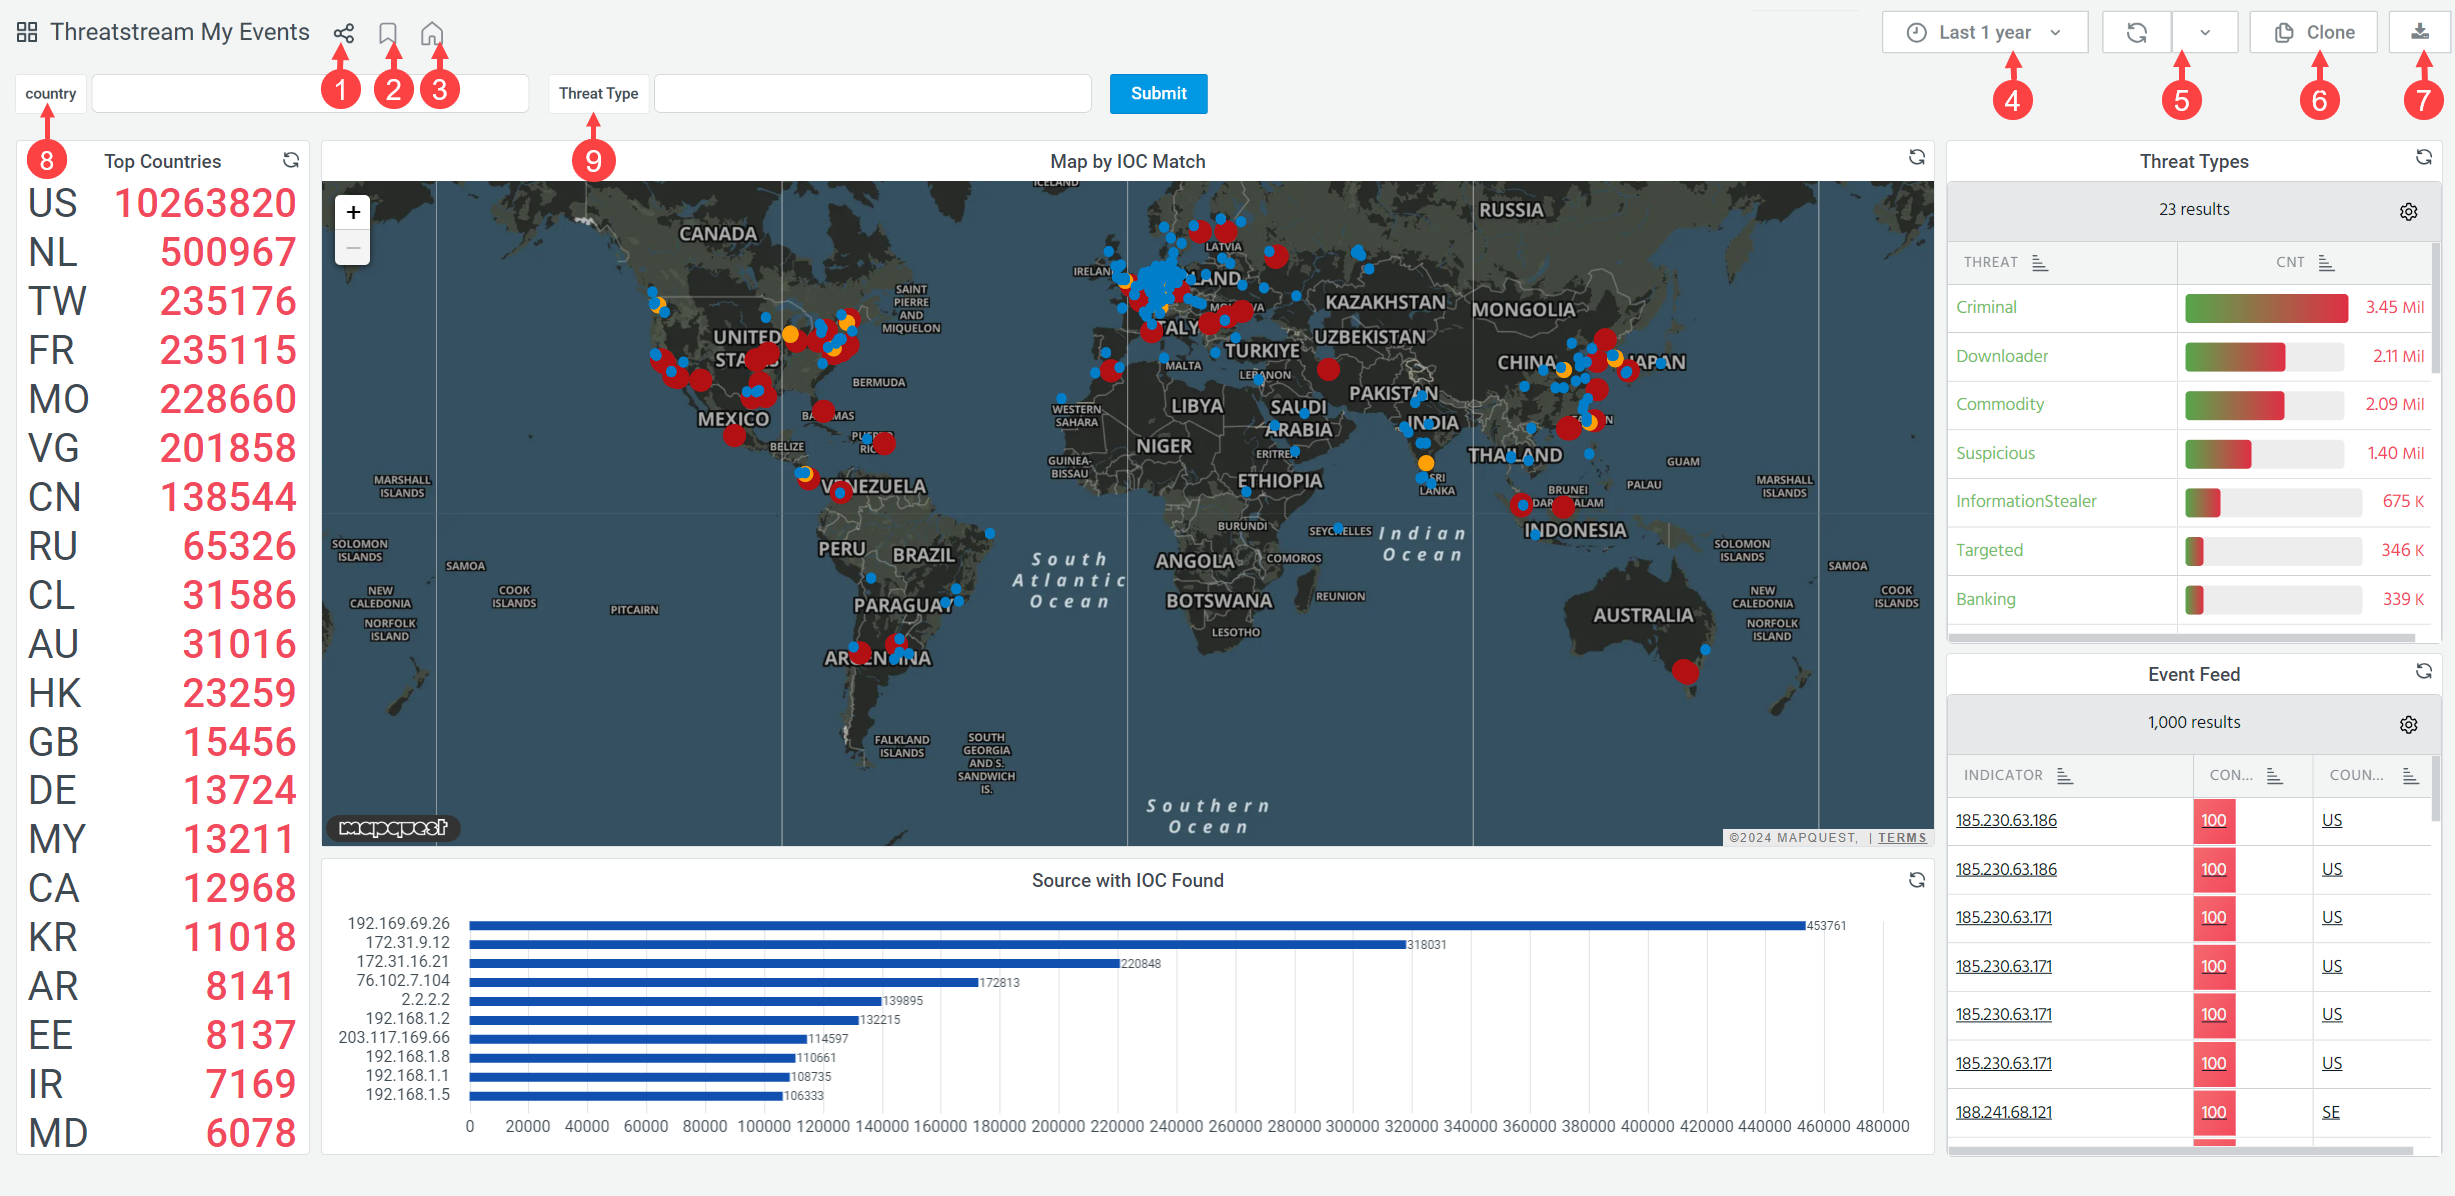
Below is an example of the ThreatStream My Events dashboard.
(Click the image to enlarge it)

|
Share the dashboard by copying the dashboard URL or exporting it in JSON format. For details, see Sharing Dashboards or Sharing Dashboards (Classic UI) if you use the classic UI. |

|
Add the dashboard to the list of favorites. All your favorite dashboards can be found in the Bookmarked section of the Dashboard menu. |

|
Designate the current dashboard as your primary dashboard. The setting is saved per user, so each user in the organization can designate their own primary dashboard. The name of the primary dashboard appears as the first item in the Dashboard menu. |

|
Select a time range for the data displayed on the dashboard. You can select an absolute time range or a relative time range. By default, data for the last 7 days is displayed.
|

|
Select a time range for refreshing the dashboard. Select Off if you don’t want to refresh the dashboard. Click |

|
Clone the dashboard. For details, see Cloning Dashboards or Cloning Dashboards (Classic UI) if you use the classic UI. |

|
Export the dashboard in PDF format. For details, see Exporting Dashboards in PDF Format or Exporting Dashboards in PDF Format if you use the classic UI. |

|
Enter a country code to display statistics on intelligence associated with the specified country. To display statistics based on all intelligence, enter * and click Submit. |

|
Enter a threat type to display statistics on intelligence of the specified threat type. To display statistics on all types of intelligence, enter * and click Submit. |
 to force dashboard refresh.
 ThreatStream My Events Dashboard Panels
The ThreatStream My Events dashboard includes the following panels:
| Top Countries | List of countries ordered by the number of observables on the map relating to each country. |
| Map by IOC Match |
Interactive map displaying geographic location of threats. Mouse over a dot on the map to view total count of observables associated with that location. |
| Threat Types | Types of threats displayed on the map. |
| Source with IOC Found | List of observable sources. |
| Event Feed |
List of recent 1,000 observables, their confidence, and country of origin. |
All ThreatStream My Events dashboard panels have the management menu enabling you to take the following actions:
-
Open a panel query in Event Search
-
View a full-screen version of a panel
-
Share a panel with other ThreatStream users in your organization.
-
Inspect panel data
-
Refresh panel data
For details, refer to Managing Dashboard Panels or Managing Dashboard Panels (Classic UI) if you use the Classic UI.