Managing Dashboard Panels (Classic UI)
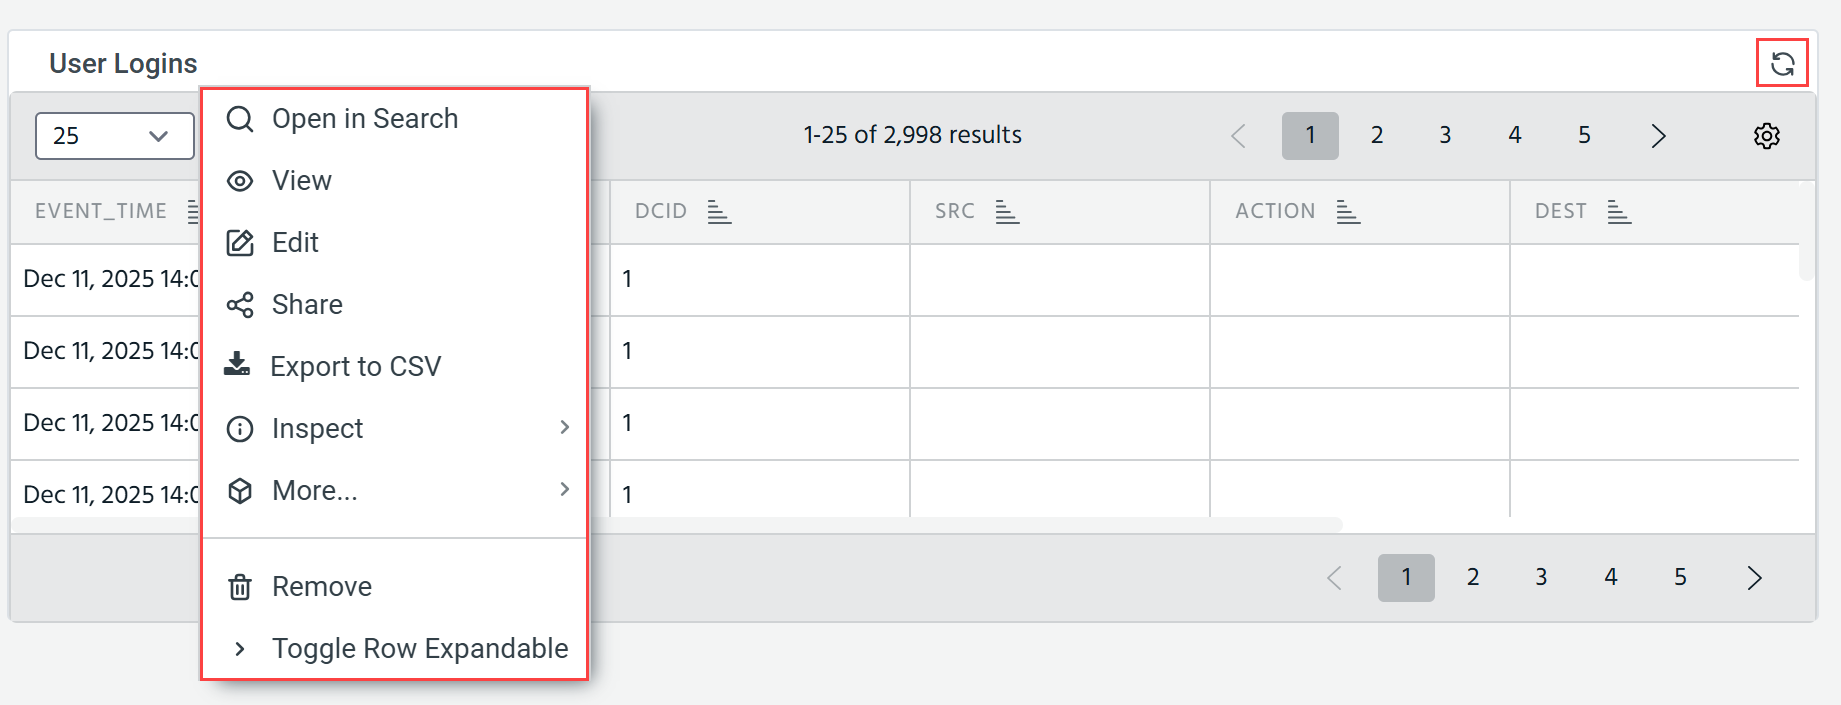
Access the panel management menu by clicking the arrow next to a panel title on a dashboard. From the panel management menu, you can take the following actions:
-
Panels of out-of-the-box dashboards cannot be modified or deleted.
-
Only Organization Administrators and dashboard owners can edit, copy, duplicate, and remove dashboard panels.
Opening a Panel AQL Query in Search
AQL queries are the data source for dashboard panels. From the panel management menu, you can open the panel query in Search.
To open a panel AQL query in Event Search:
-
Mouse over the space to the right of the panel title and click the expander to display the panel management menu.
-
Select Open in Search.
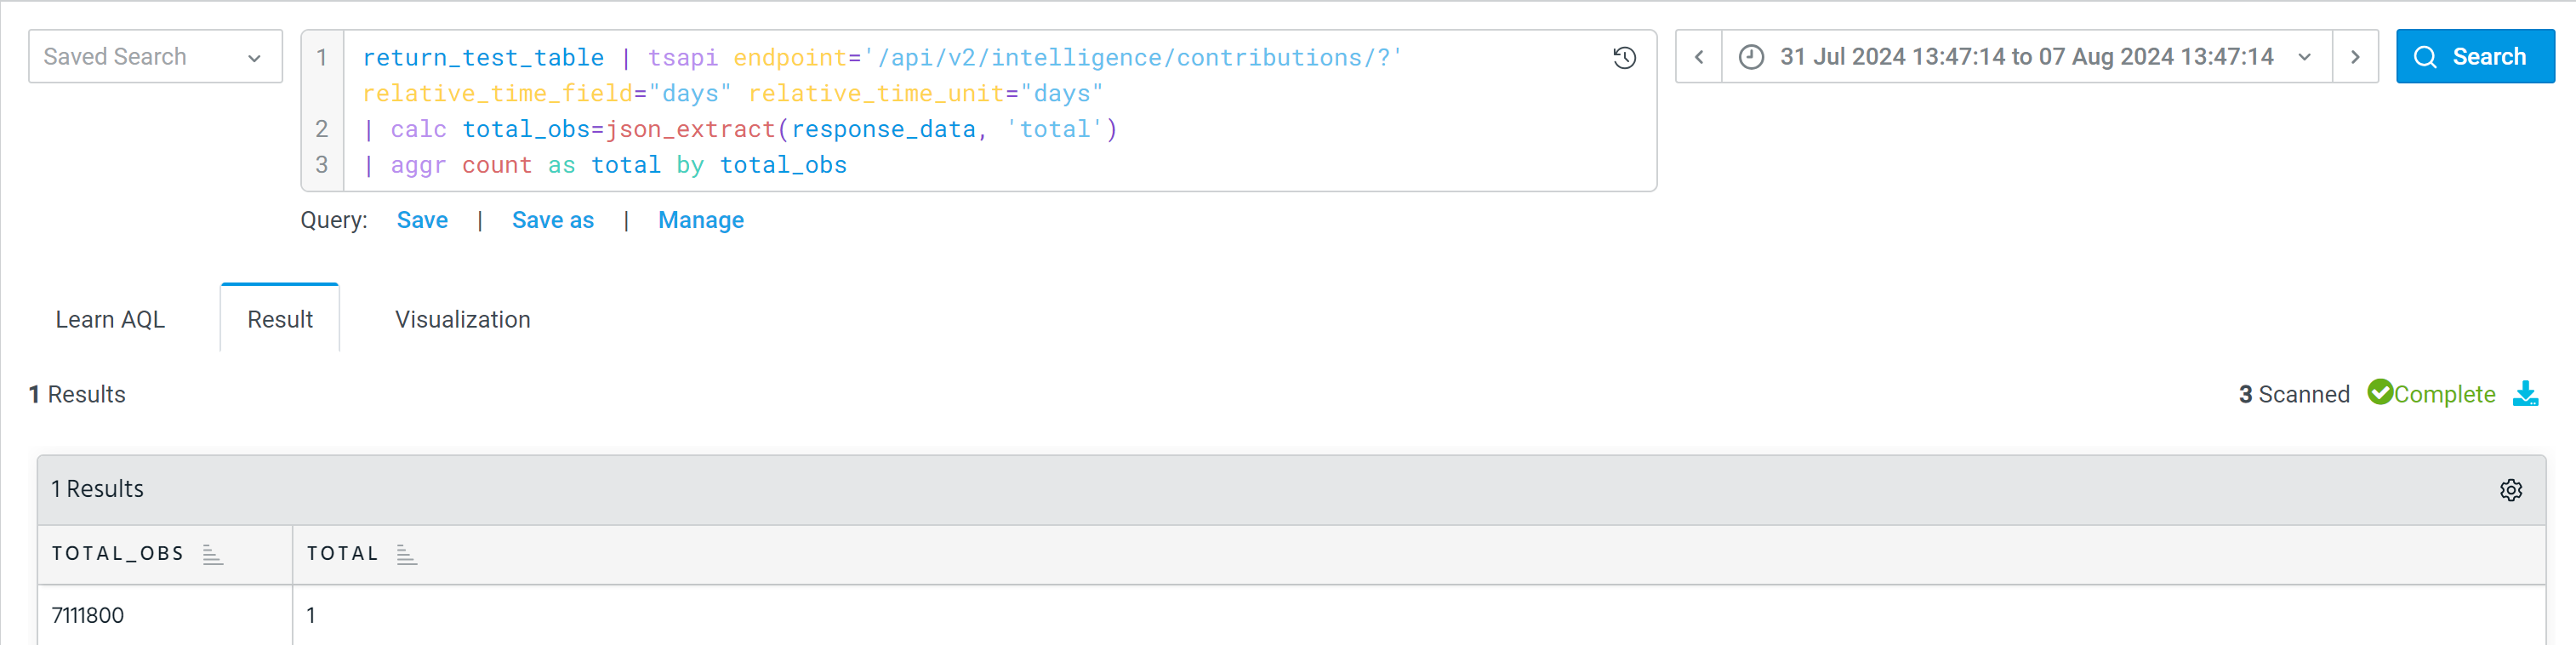
Below is an example of the Total # of Observables panel opened in Event Search.
Viewing Panels
To view a full-screen version of a panel:
-
Mouse over to the right of the panel title and click the expander to display the panel management menu.
-
Click View.
Editing Panel Settings
After an Event Search visualization has been added to a dashboard, you can modify visualization and panel settings.
To edit panel settings:
-
Click Edit on the dashboard.
-
Mouse over the space to the right of the panel title and click the expander to display the panel management menu.
-
Click Edit.
-
Modify visualization and panel settings.
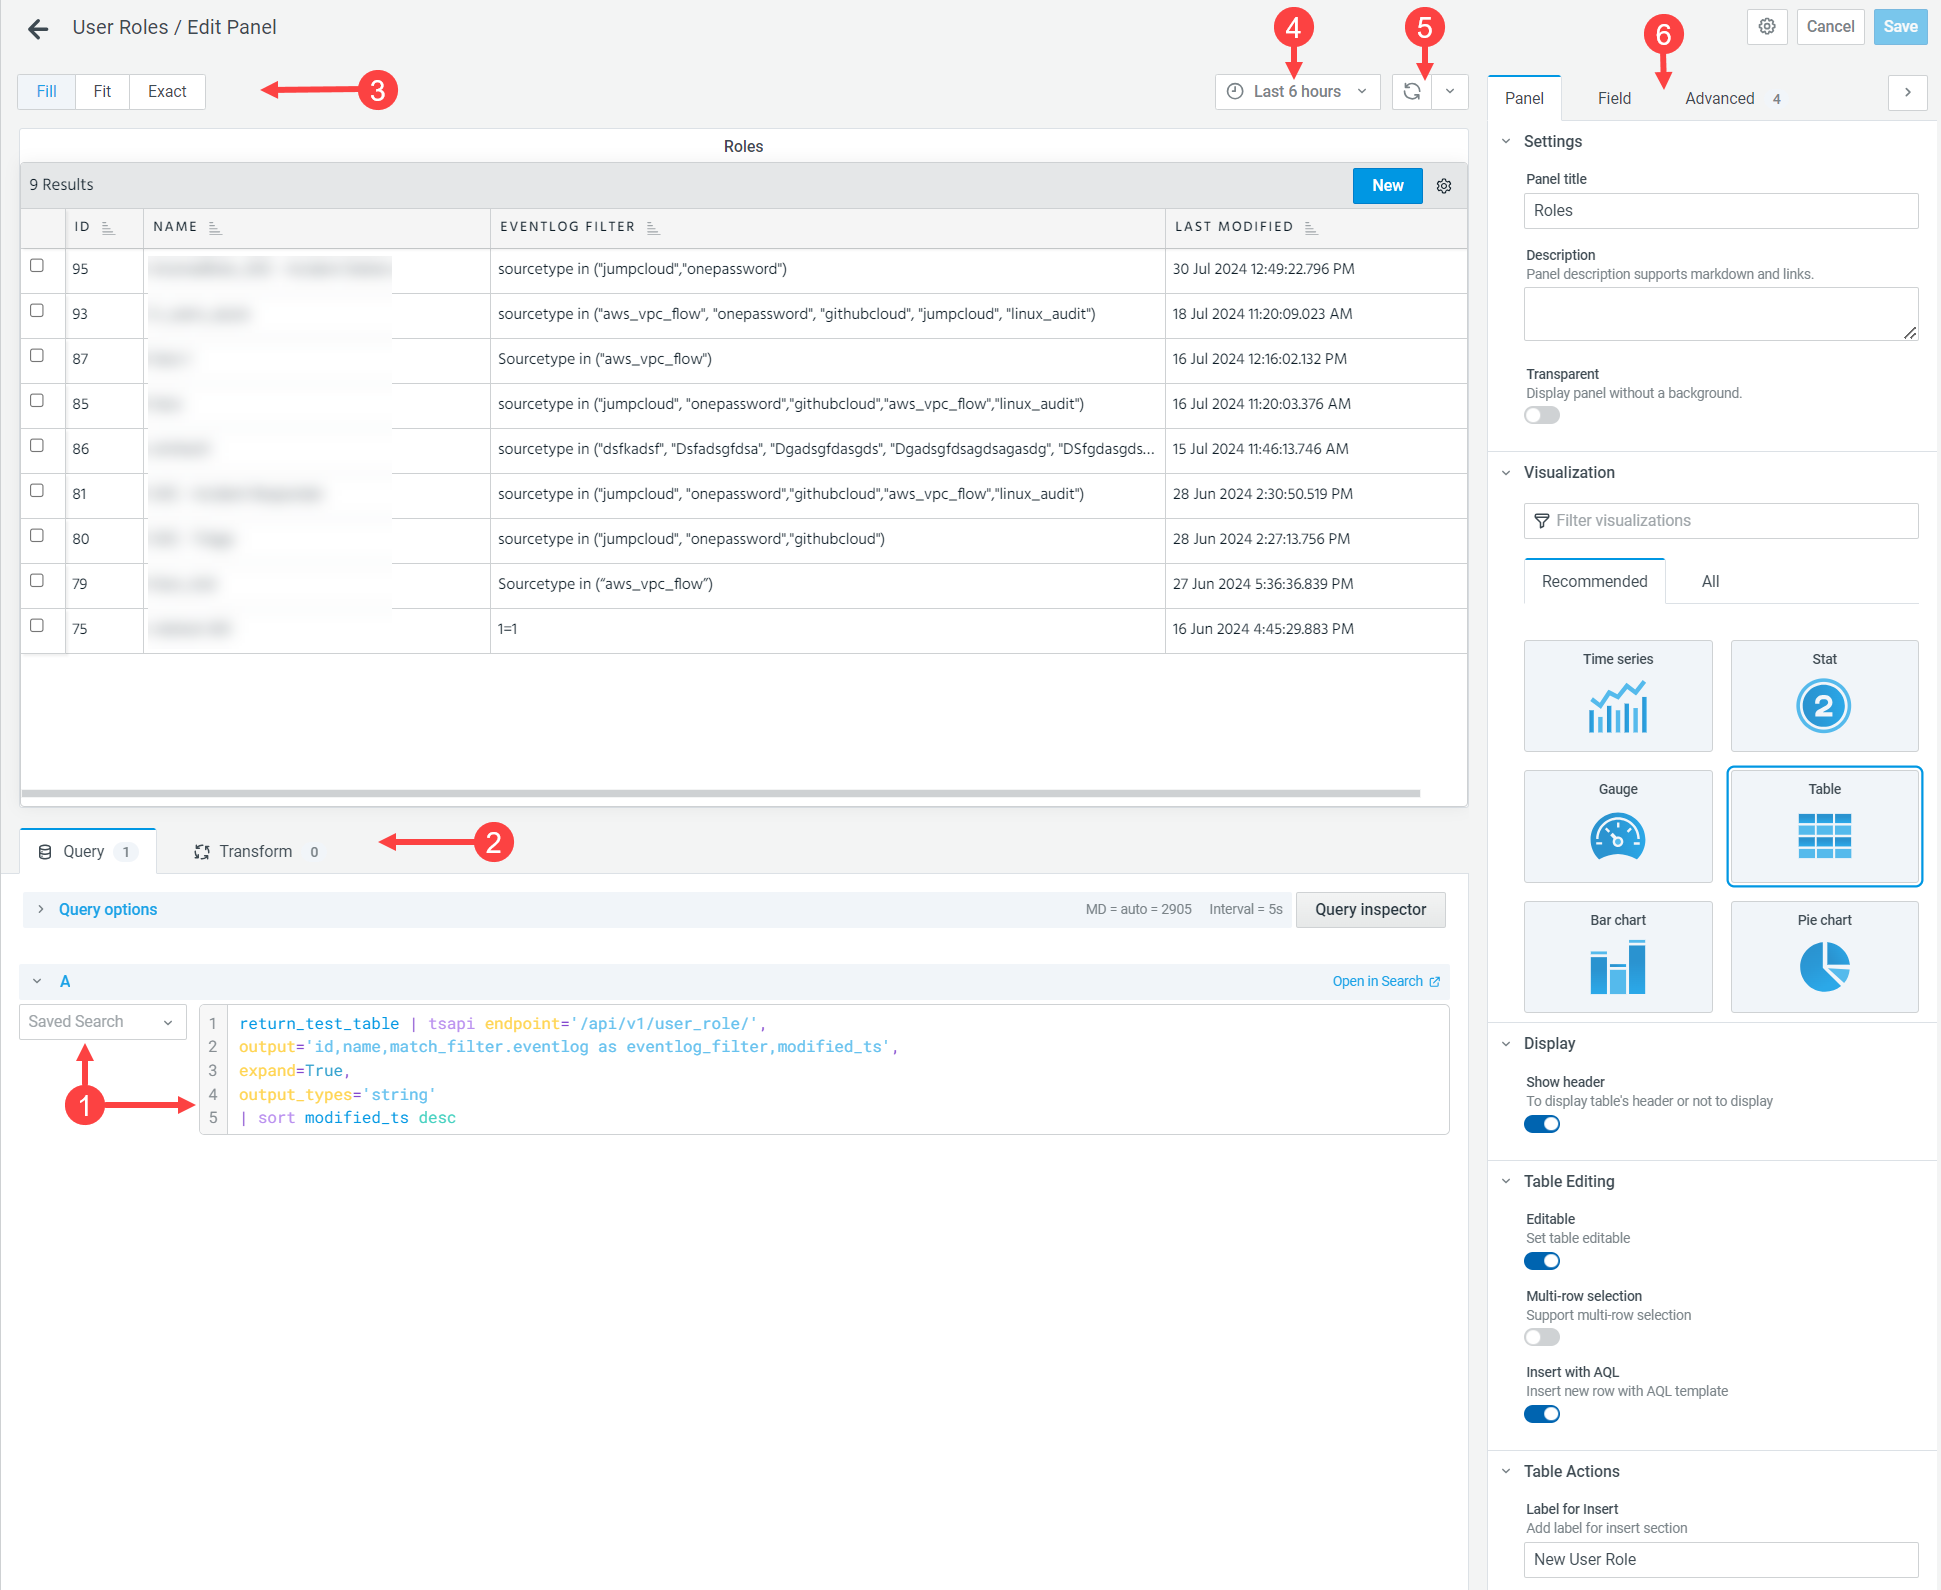

AQL data source: Select a saved search or enter a valid AQL query. 
Transform: Advanced users can specify the following transform options:
-
Reduce: Configure a function to reduce rows or data points to a single value.
-
Filter data by values: Apply additional result filters to the result set.
-
Organize fields: Rename or reorder fields.
-
Labels to fields: Changes time series results that include labels or tags into a table where the label keys and values are included in the table result.
-
Group by: Group fields and then calculate values for the group.
-
Sort by: Sort results by the selected field. Use the Reverse option to change the sort order.

Preview Scaling: Click an option to fit the visualization to the preview canvas.: Click an option to fit the visualization to the preview canvas.
Fill: The visualization preview fills the preview canvas. If you change properties, the preview adapts to fill the available space.
Fit: The visualization preview fills the preview canvas but preserves the aspect ratio.
Exact: The visualization preview has the exact size it will have when placed on a dashboard. If necessary, the size scales down but preserves the aspect ratio.

Time Range: Select a relative expression, quick range, or specify an absolute time range. The time period filter is based on event time; in other words, the timestamp in the event log.
Notes:
-
Event time is UTC time, adjusted to the web browser local time zone.
-
When you save a panel or a dashboard, you have the option to save the time range for the current panel for all panels in the dashboard.

Refresh: Click to refresh the data and the visualization preview. 
Settings Group Tabs:
-
Panel
Use the Panel tab to specify a panel title and to select a visualization type and data fields, among other options. Refer to Panel Settings for more information.
-
Field
Use the Field tab to define options for rendering data fields in the visualization. Refer to Field Settings for more information.
-
Advanced
Use the Advanced tab to define options for specific fields that you want to be different from the settings defined on the Fields tab. Refer to Advanced Settings for more information.
-
Sharing Panels
You can share a panel with any user in your organization who can log in to the Anomali platform and use Search.
To share a panel:
-
Mouse over the space to the right of the panel title and click the expander to display the panel management menu.
-
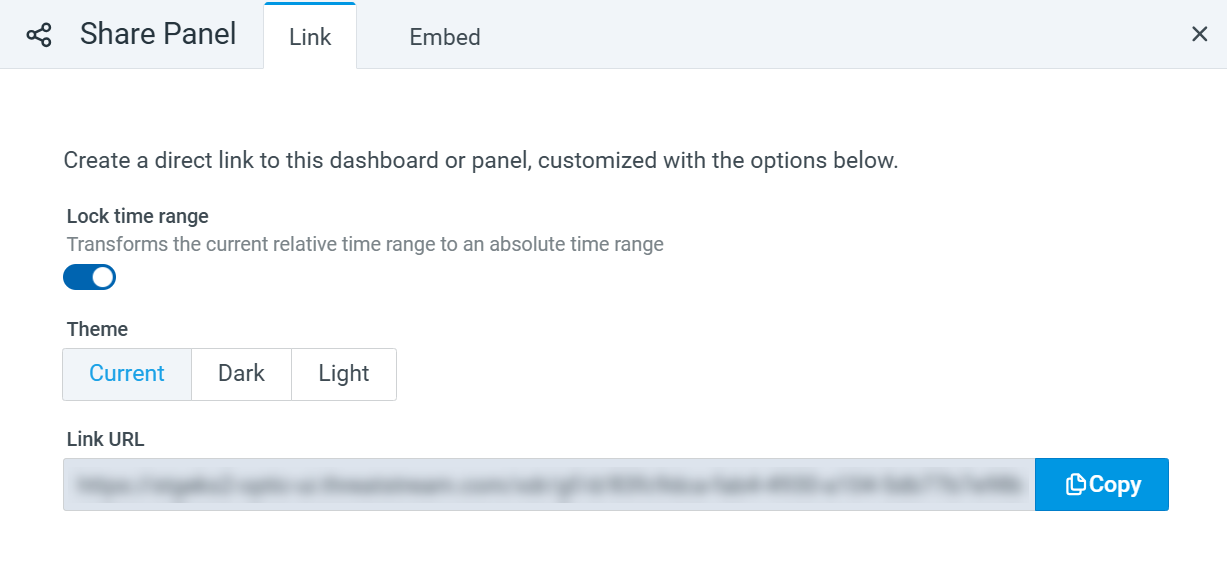
Click Share to display the Share Panel pop-up.
-
Configure the following parameters:
-
Link or Embed: Use the tabs to toggle between link or embedded HTML code options.
-
Lock time range: Convert a relative time range to an absolute time.
-
Theme: Dark or Light.
-
-
Click Copy or Copy to Clipboard to copy the URL or the embedded HTML code.
Exporting Panel Details to CSV
You can export panel details to a CSV file.
To export a panel to CSV:
-
Mouse over the space to the right of the panel title and click the expander to display the panel management menu.
-
Click Export to CSV.
The CSV file download starts immediately.
Inspecting Panel Details
To inspect panel details:
-
Mouse over the space to the right of the panel title and click the expander to display the panel management menu.
-
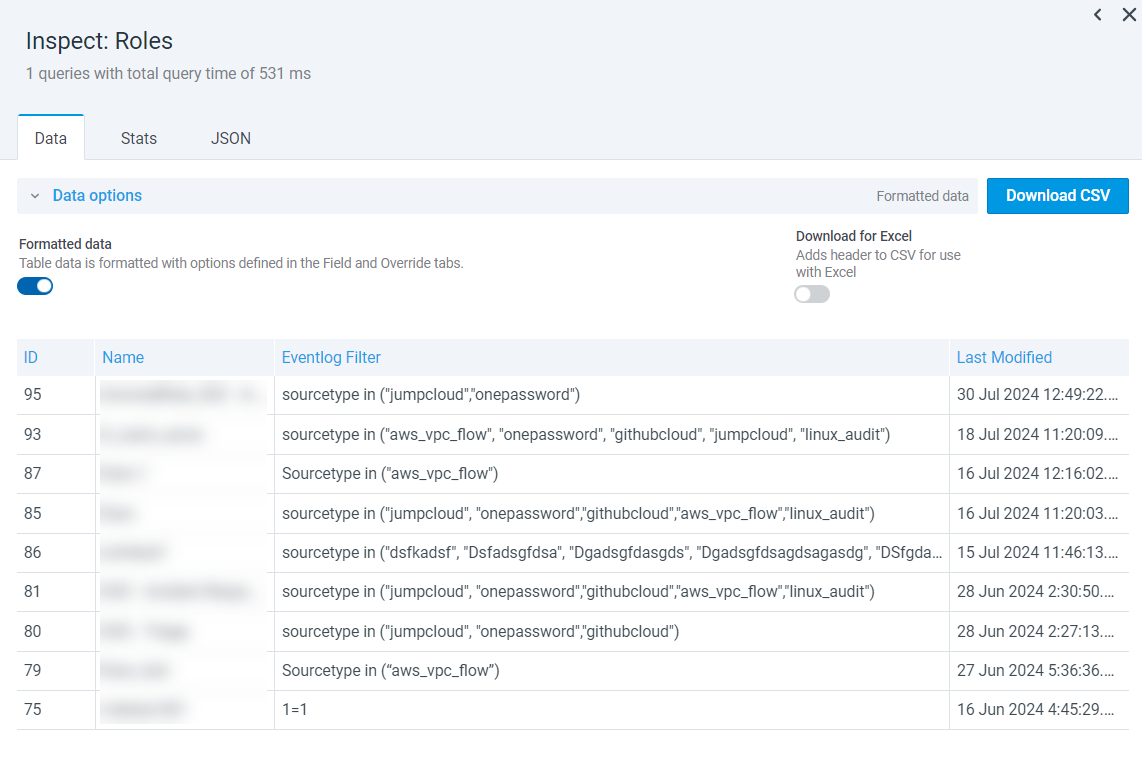
Select Inspect > Data.
The Inspector slide-out panel displays tabular results.
-
Toggle options to format data or add headers.
To export the results table, click Download CSV.
Viewing the Panel JSON Model
You can review the panel JSON model details to help you understand and troubleshoot panel settings.
To view the panel JSON Model:
-
Mouse over the space to the right of the panel title and click the expander to display the panel management menu.
-
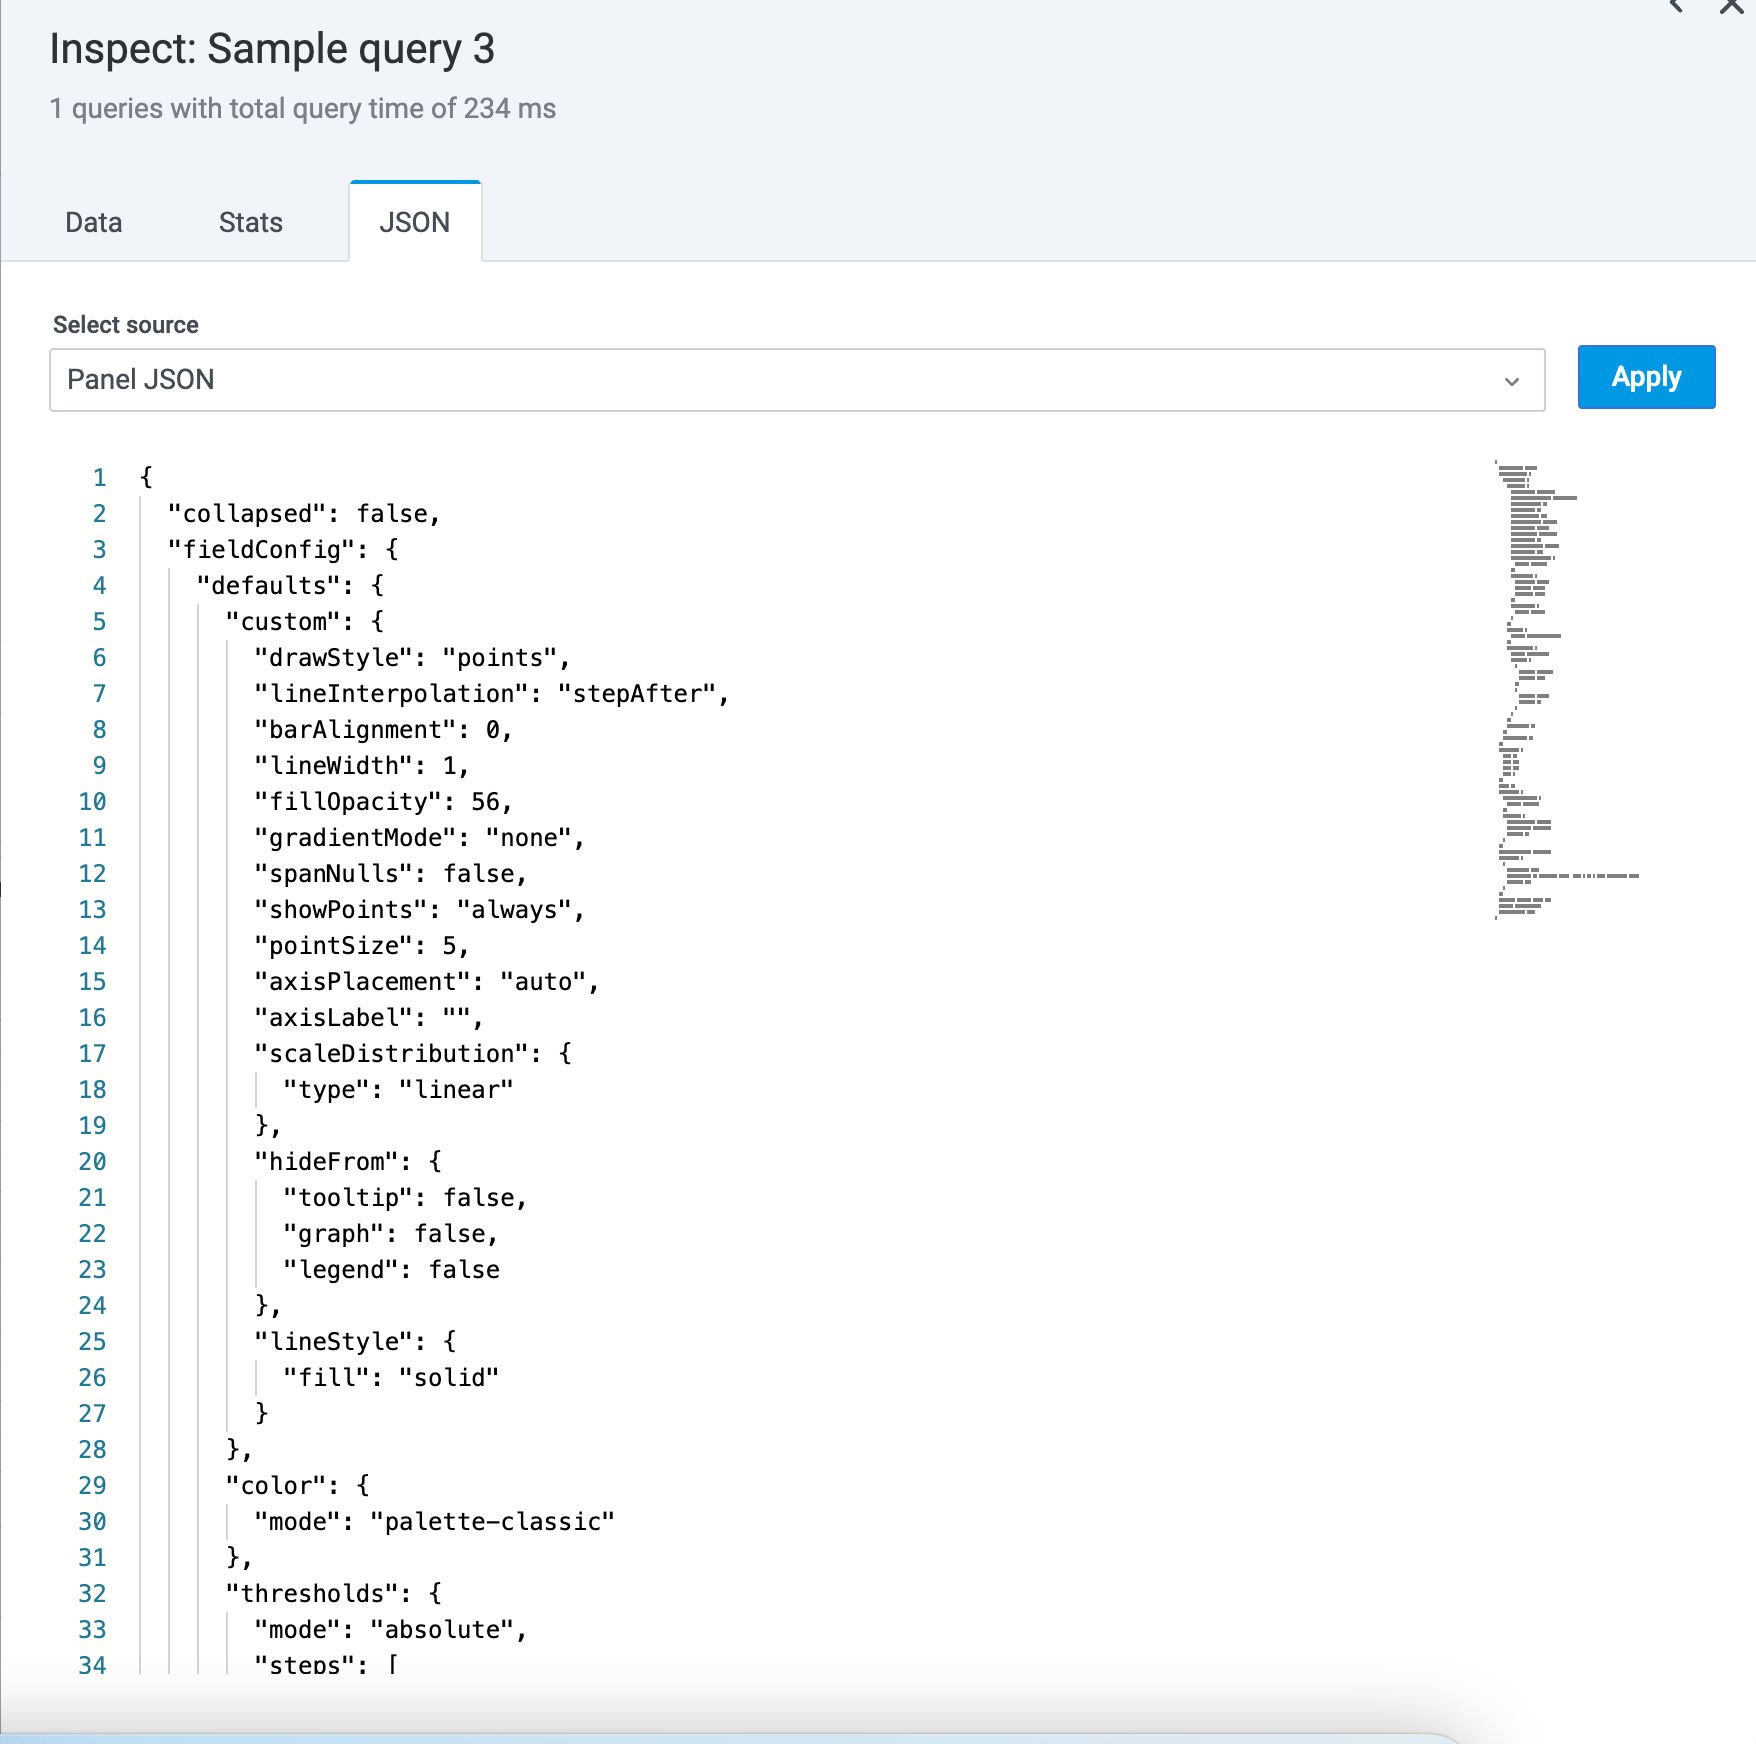
Select Inspect > Panel JSON.
The Inspector slide-out panel shows the Panel JSON. You can use the Select source drop-down list to switch to the JSON for Data or DataFrame structure.
-
Expert users only. Edit the JSON and click Apply to update the panel with your changes.
Duplicating Panels
You can duplicate a panel on the same dashboard if you want to use a current panel as a template for a new panel with some differences.
To duplicate a panel:
-
Click Edit on the dashboard.
-
Mouse over the space to the right of the panel title and click the expander to display the panel management menu.
-
Select More > Duplicate.
A duplicate panel is added to the dashboard.
Copying Panels
You can copy a panel to the clipboard to use it in a different dashboard.
To copy a panel:
-
Click Edit on the dashboard.
-
Mouse over the space to the right of the panel title and click the expander to display the panel management menu.
-
Select More > Copy.
-
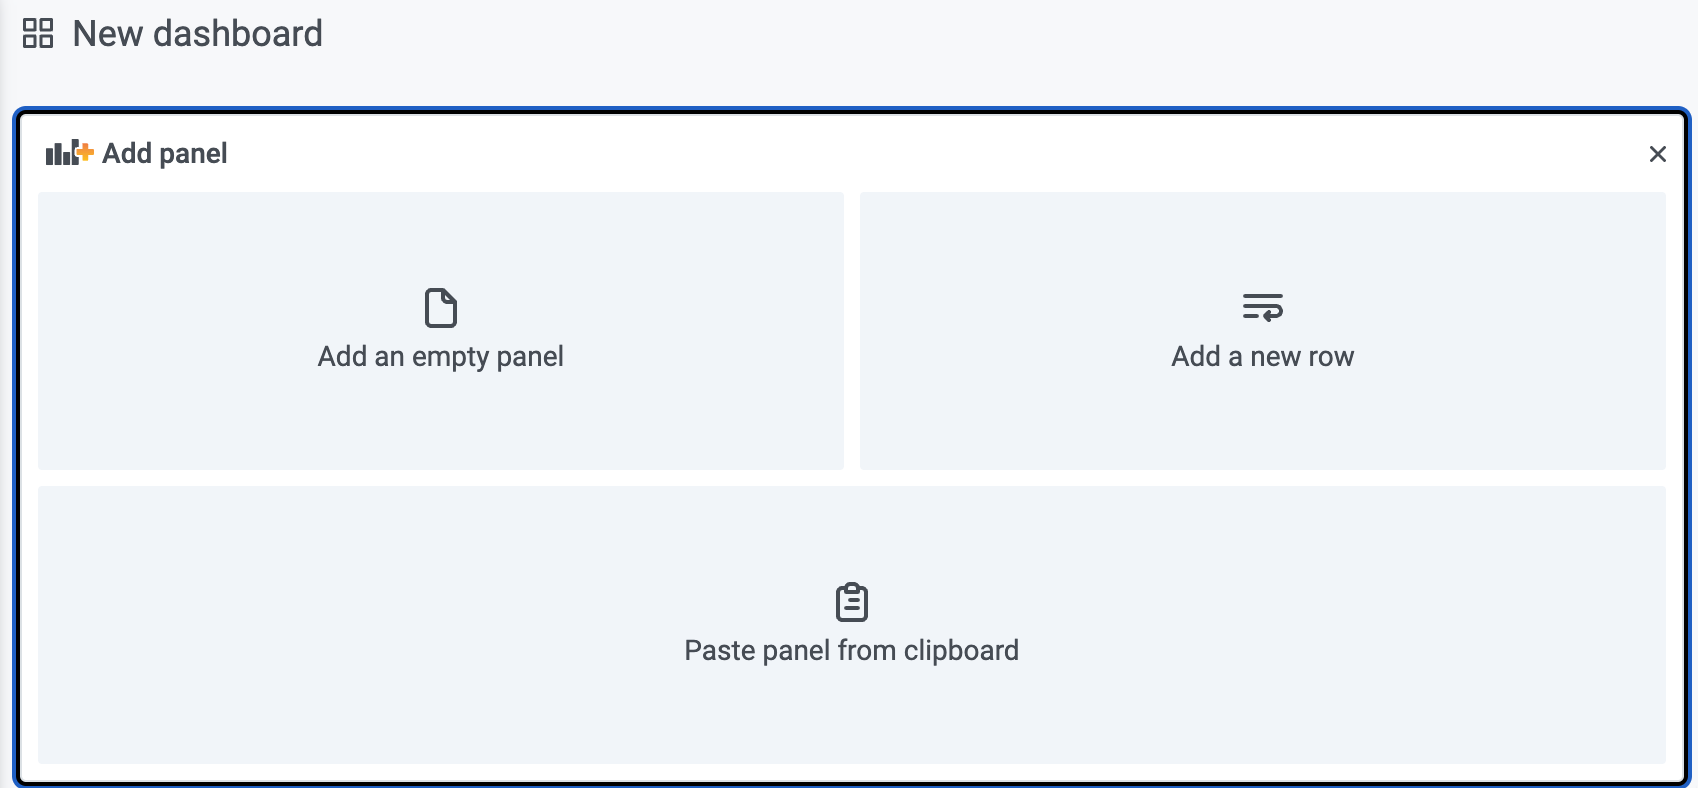
To use the copy, go to a new or different dashboard, click Edit, and click the Add panel icon (
 ) in the tool bar in the upper right corner of the Dashboard you want to modify.
Note that the Paste panel from clipboard option is present only when your clipboard has a panel.
-
Click the Paste panel from clipboard option.
Removing Panels
You can remove panels from any custom dashboard.
To remove a panel:
-
Click Edit on the dashboard.
-
Mouse over the space to the right of the panel title and click the expander to display the panel management menu.
-
Click Remove.
The panel is removed from the dashboard.
Expanding Table Rows
If a panel includes a table, you can expand table rows to view all row details.
To expand rows:
-
Mouse over the space to the right of the panel title and click the expander to display the panel management menu.
-
Click Toggle Row Expandable. By default, rows are not expandable.
Refreshing Panel Data
All users can force refresh panel data.
To refresh panel data, click  on the panel of your interest.