License Limits and Usage Dashboard
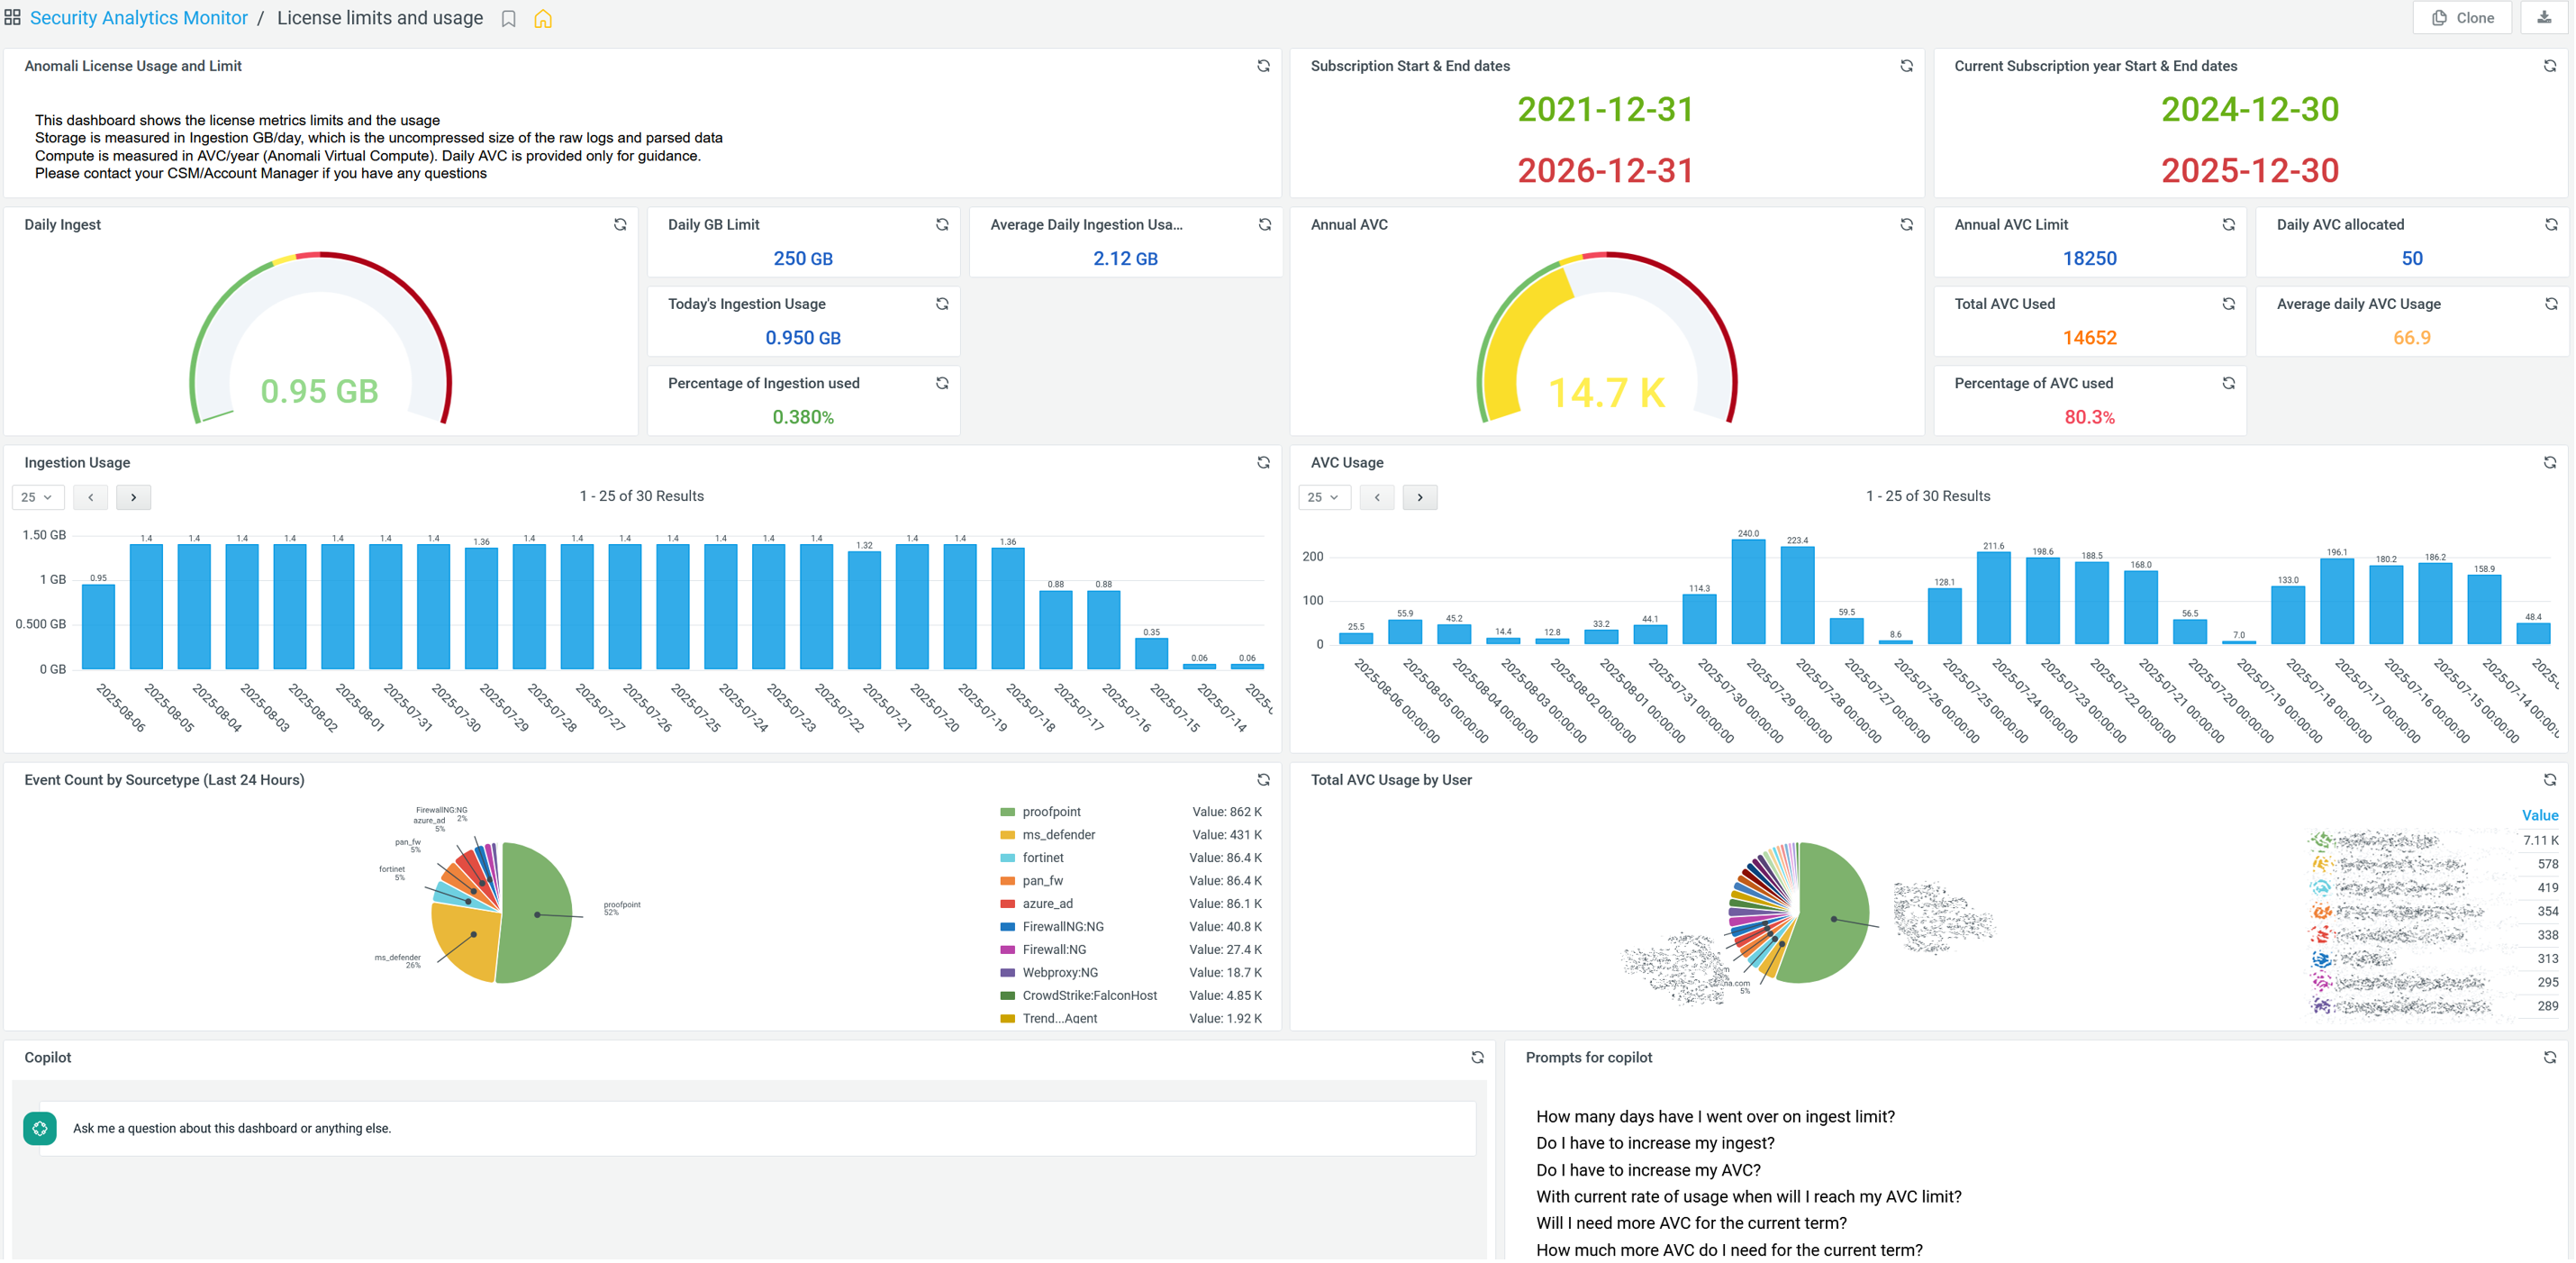
Anomali Security Analytics offers the License Limits and Usage Dashboard out-of-the-box that helps Organization Administrators investigate, and monitor both the data ingestion as well as Anomali Virtual Compute (AVC) usage trends of the Anomali SaaS platform, based on the usage of Anomali virtual compute infrastructure.
See Anomali Virtual Compute to learn more about how it works and how you can monitor it on the Anomali platform.
(Click the image to enlarge it)
Accessing the Dashboard
To access the License Limits and Usage dashboard:
-
Navigate to Dashboard > Library.
-
Click the Security Analytics Monitor folder.
-
Click License Limits and Usage.
Dashboard Timeline
The License Limits and Usage Dashboard tracks the timeline of your subscription and uses the annual subscription start and end dates to power its dashboard panels. Specifically, this dashboard uses the Subscription Start and End dates timeline to power all the dashboard's panels.
Using Dashboard Panels
The following table contains the list of all panels available on the License Limits and Usage Dashboard.
| Panel | Description |
|---|---|
| Anomali License Usage and Limit |
Describes what the License Usage and Limit Dashboard offers, its different panels, the metrics it helps you monitor and interact with. |
| Subscription Start & End dates |
Tells you the start and end dates of your Anomali license subscription. These dates are used for Annual AVC. |
| Current Subscription year Start & End dates | Tells you the start and end dates of your current year's Anomali license subscription. |
| Daily Ingest |
Denotes the volume of ingested data (in GB). |
| Daily GB Limit |
Denotes the daily ingestion data limit (in GB) that your org is licensed for. |
|
Today's Ingestion Usage |
Tells you today's ingestion usage so far, for your org. |
| Percentage of Ingestion used | Captures the total % of ingestion data capacity used today so far. |
| Average Daily Ingestion Usage | Captures the average volume of ingestion data capacity for the current subscription year. |
| Annual AVC | Denotes the annual AVC units your org has consumed so far for the current subscription year. See Anomali Virtual Compute for more information. |
| Annual AVC Limit | Denotes the AVC limit your org has consumed for the current year. |
| Percentage of AVC used | Displays the total % of AVC capacity used so far. |
| Daily AVC allocated | Provided as a guideline to show how many AVCs your org can use in a day.This is calculated as Annual AVC limit/365. |
| Average daily AVC Usage | Displays the average daily AVC units consumed so far. |
| Ingestion Usage | Captures the historic trend of the volume of the ingested data (in GB). |
| AVC Usage | Captures the historic trend of the AVC units consumed. |
| Event Count by Sourcetype (Last 24 Hours) | Captures the 24-hour distribution of the number of events based on sourcetype |
| Total AVC Usage by User | Denotes the total number of AVC units consumed by the current user. |
| Copilot |
AI-powered widget that lets you ask a question about any panel in the dashboard and provides critical insights on threat hunting, enrichments, integrators, and more, based on its ability to analyze and summarize different panels in the License Limits and Usage Dashboard. See Copilot Widget to learn more about the different use cases it supports. |
| Prompts for Copilot | Suggests the most useful or relevant questions about the License Limits and Usage Dashboard that you can ask Copilot. |
All License Limits and Usage Dashboard panels have the management menu allowing you to take the following actions:
-
Open a panel query in Event Search
-
View a full-screen version of a panel
-
Share a panel with other ThreatStream users in your organization.
-
Inspect panel data
-
Refresh panel data
For details, refer to Managing Dashboard Panels or Managing Dashboard Panels (Classic UI) if you use the Classic UI.
Managing the Dashboard
The License Limits and Usage Dashboard lets you clone and export the dashboard and its panels, using the Clone and Export icons on the top-right of the dashboard.
For details, refer to Managing Dashboards or Managing Dashboards (Classic UI) if you use the classic UI.