Alert Triage Dashboard
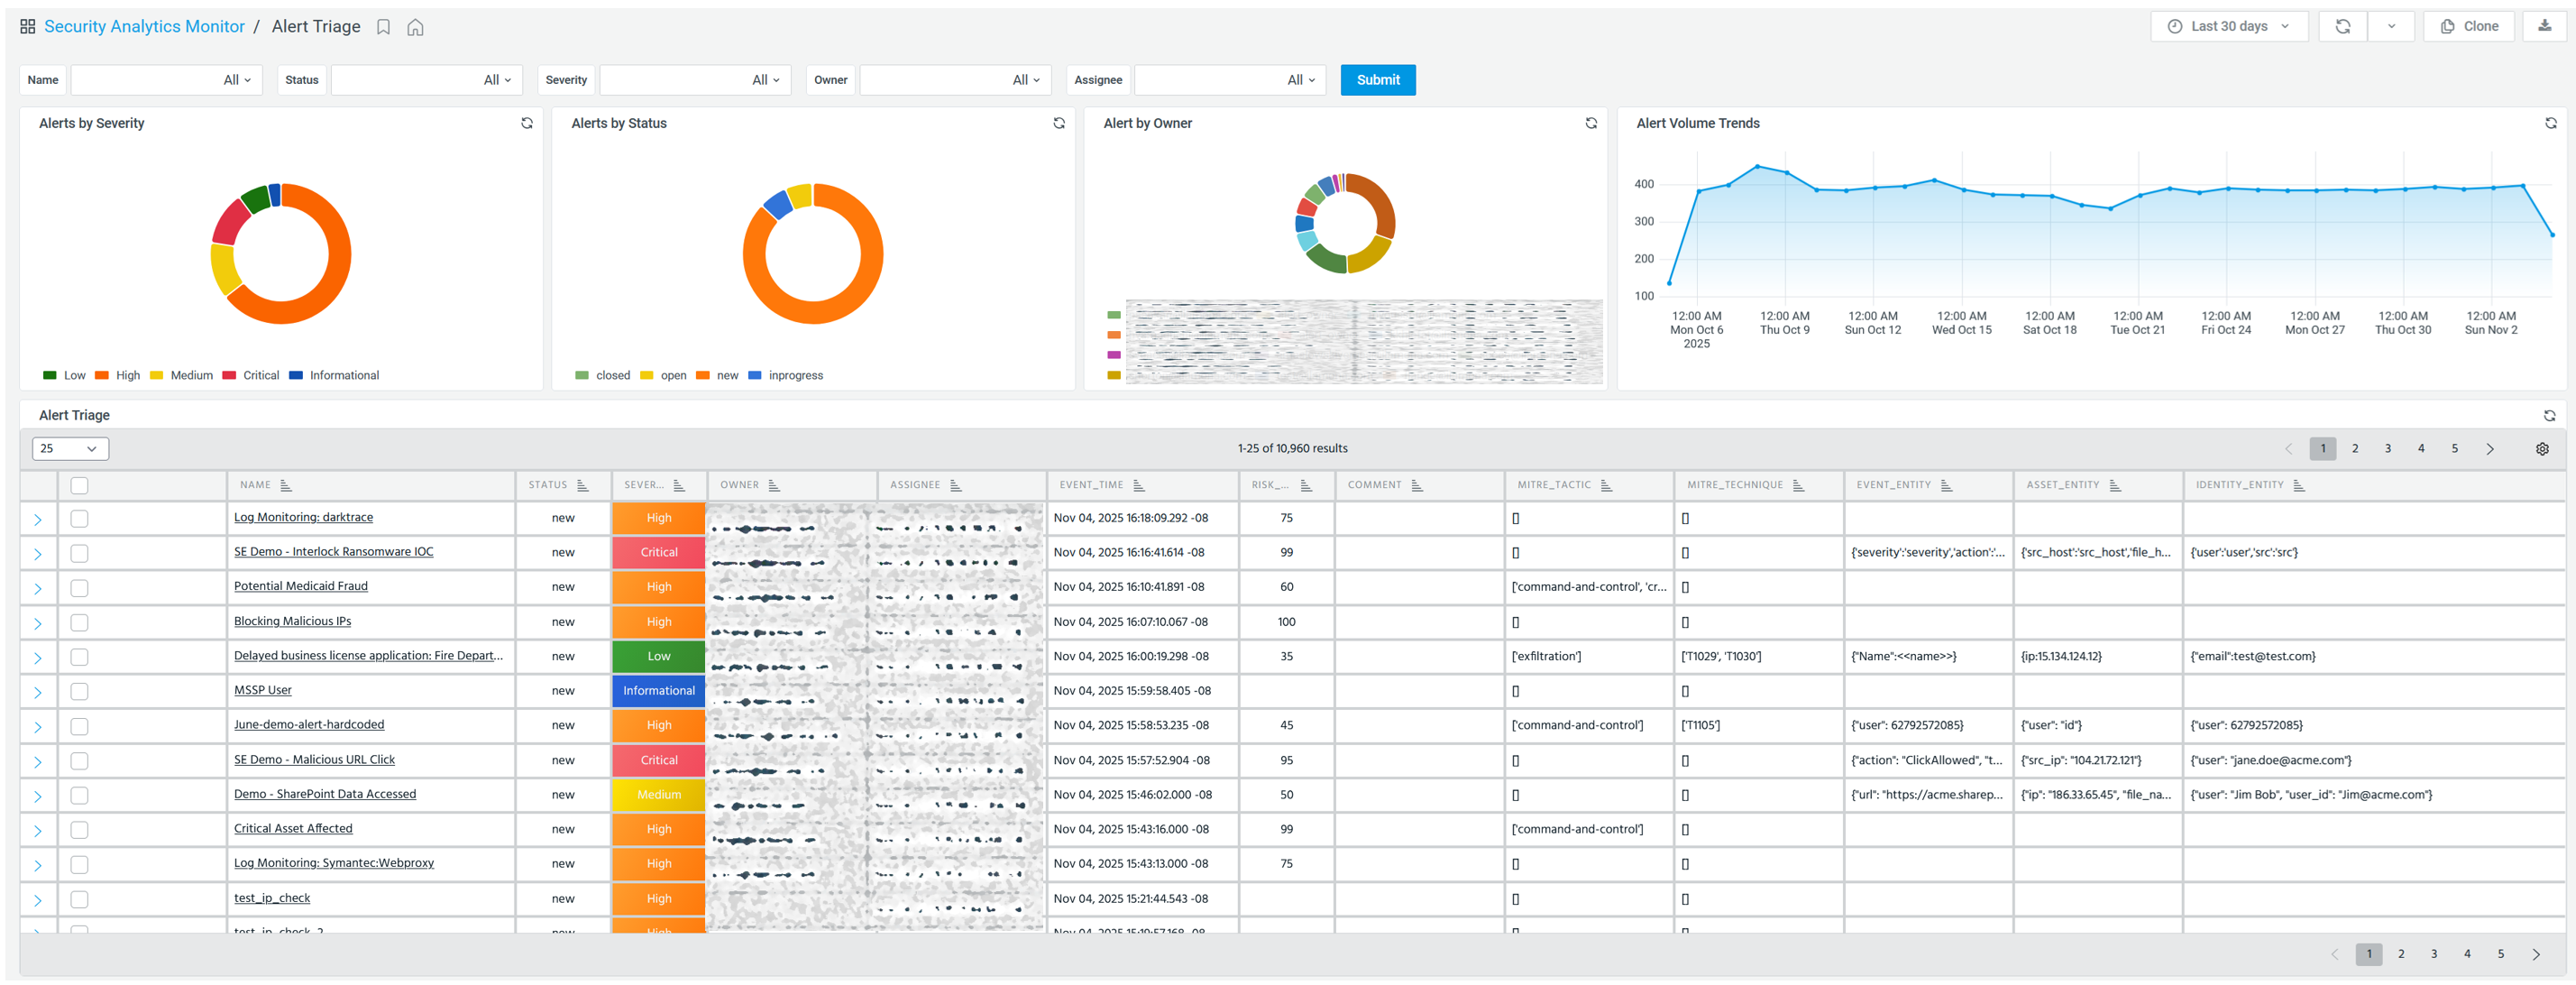
Anomali Security Analytics offers the Alert Triage dashboard that is designed to help analysts prioritize, investigate, and take action on alerts generated by matching against several IOCs.
Specifically, these alerts are triggered by IOC matches between internal telemetry and IOCs from Anomali or third-party feeds, employing enrichments including actor profiles, malware, or TTPs, among other resources, to ensure fast, accurate, effective, and centralized alert reporting, investigation, and management.
(Click the image to enlarge it)
Accessing the Dashboard
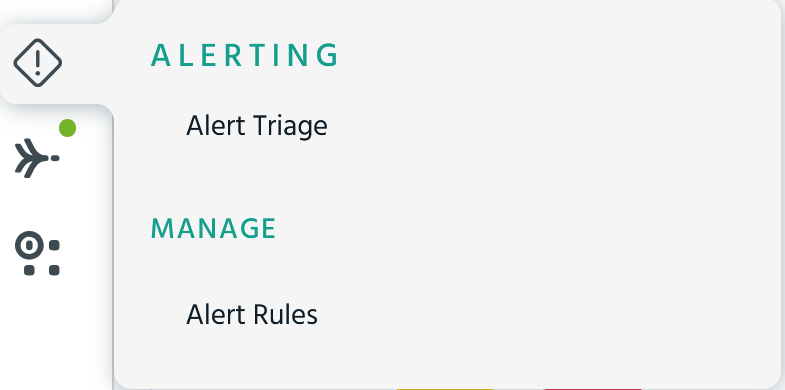
To access the Alert Triage Dashboard, click Alerting > Alert Triage. This dashboard is one of the dashboards available to all Anomali platform users out of the box.
Managing Dashboard Timeline
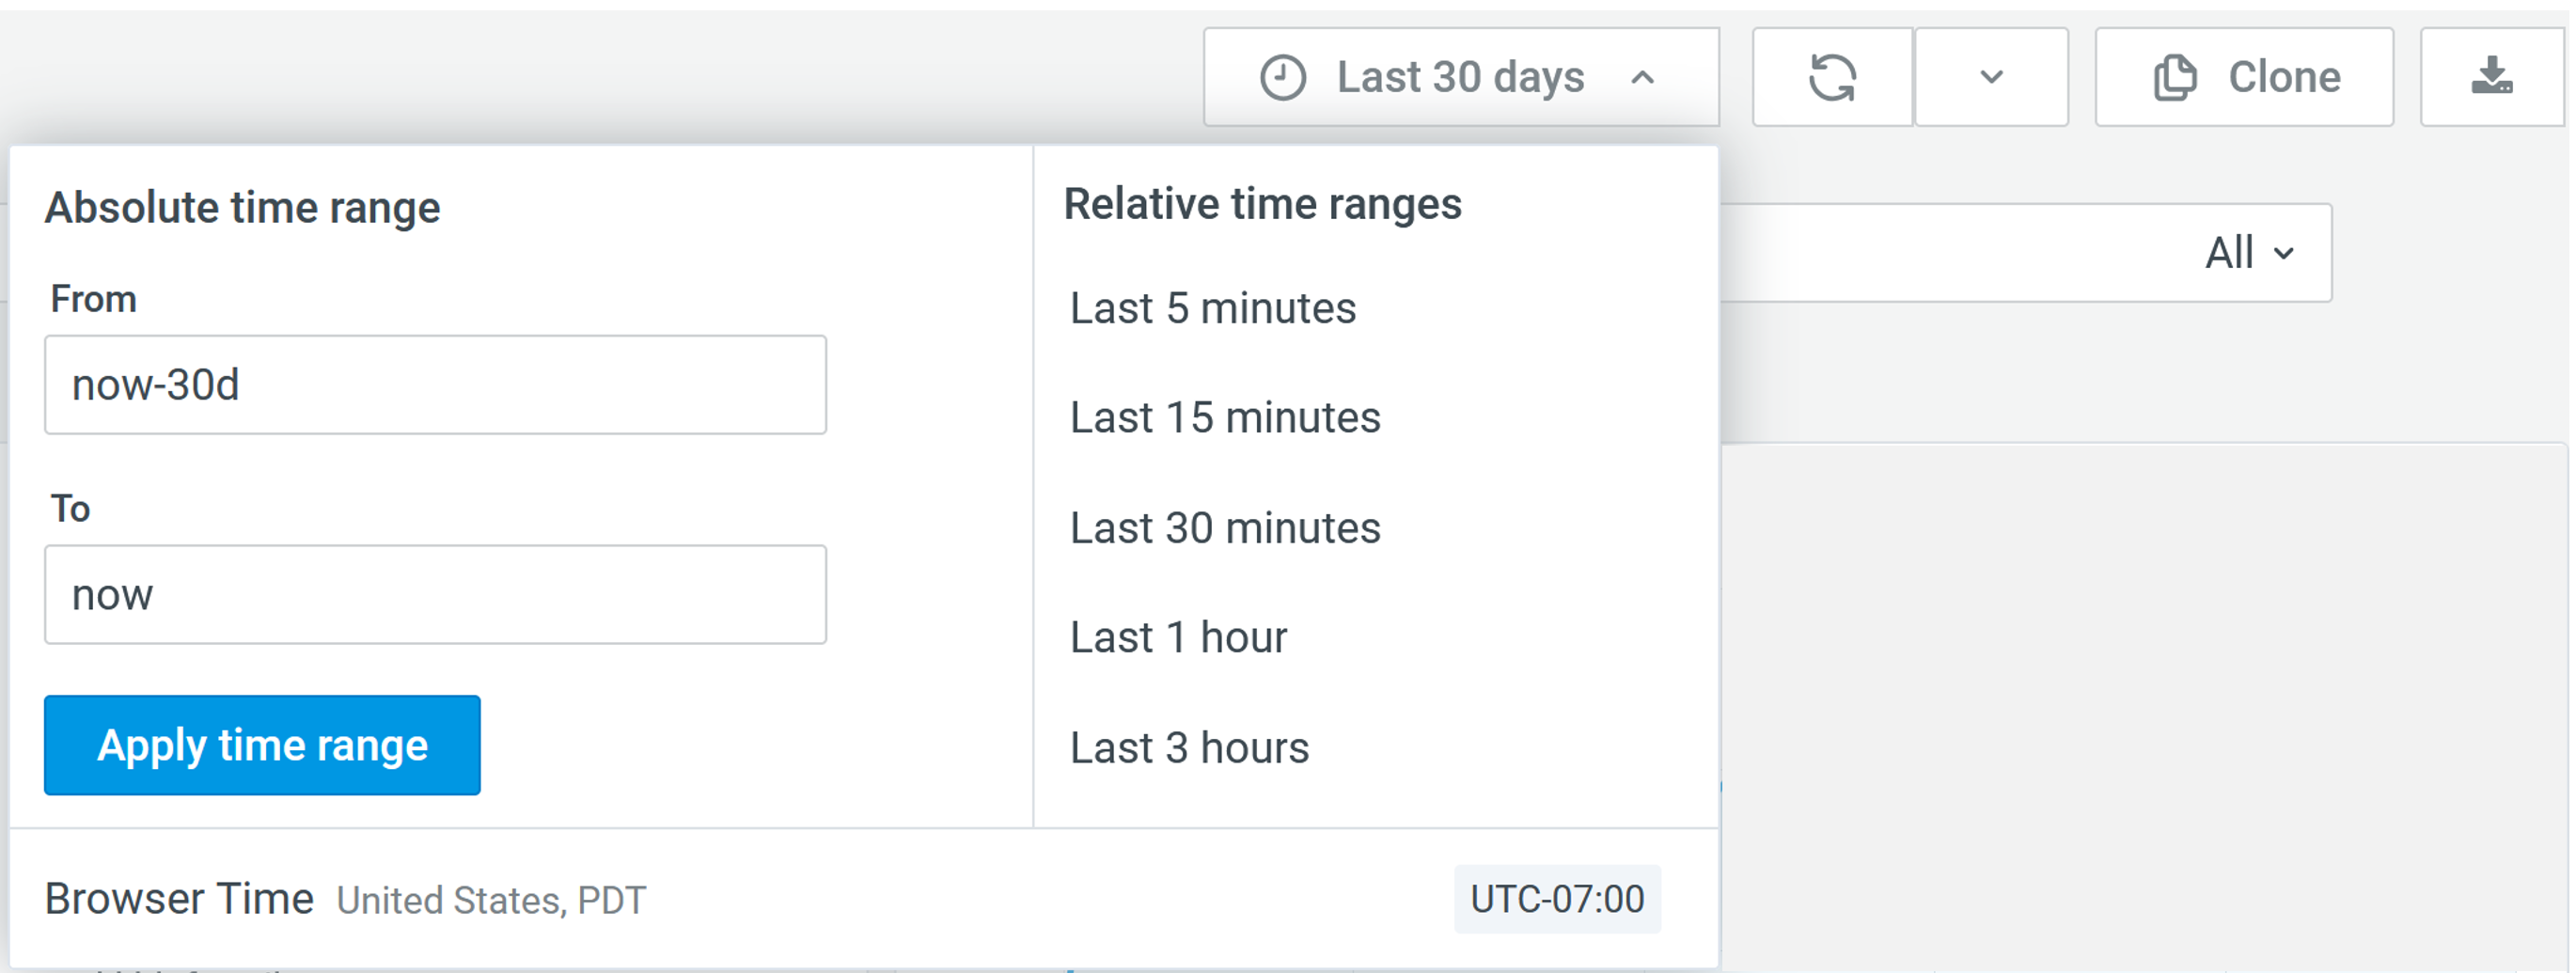
The Alert Triage Dashboard allows you to select a customizable time range for the data displayed on the dashboard. This selection includes selecting an absolute time range or a relative time range, such as now-7d that displays results for alerts spanning the last 7 days. By default, data for the last 30 days is displayed.
You can also click the Refresh icon ( ) to manually refresh the dashboard panels. Alternatively, you can select a time period from the refresh time picker — next to the Refresh icon — that automatically refreshes the dashboard panels after the selected time period (in minutes).
Alert Triage Dashboard Panels
The following table contains the list of all panels available on the Alert Triage Dashboard.
| Panel | Description |
|---|---|
| Alerts by Severity | Severity of the alerts triggered in the time range selected for the dashboard, ranging from low, medium, high, to critical severity. |
| Alerts by Status | Denotes the Status that the creator of the alert wants to assign to the triggered alert. |
| Alerts by Owner | Displays the number of alerts owned by a certain owner, represented by the email address of either the creator or the analyst that will address this alert. |
| Alert Volume Trends | Captures the trends of alert volumes triggered in the time range selected for the dashboard. |
| Alert Triage |
Captures all the details associated with an alert, including but not limited to:
Alert Triage actionsSelecting an existing alert in the Alert Triage panel lets you edit the parameters of an existing alert as well as add the alert to either a new or an existing investigation. Edit alert
Create investigation
|
All Alert Triage Dashboard panels have the management menu allowing you to take the following actions:
-
Open a panel query in Event Search
-
View a full-screen version of a panel
-
Share a panel with other ThreatStream users in your organization.
-
Inspect panel data
-
Refresh panel data
For details, refer to Managing Dashboard Panels or Managing Dashboard Panels (Classic UI) if you use the Classic UI.
Cloning the Dashboard
On the Alert Triage Dashboard, click Clone on the top-right to clone the existing dashboard. You can edit a dashboard you cloned.
For details, refer to Managing Dashboards or Managing Dashboards (Classic UI) if you use the classic UI.
Exporting the Dashboard
On the Alert Triage Dashboard, click the Export icon ( ) on the top-right to clone the existing dashboard.
For details, refer to Managing Dashboards or Managing Dashboards (Classic UI) if you use the classic UI.