Custom Dashboards
Custom dashboards offer query-driven visualizations, enabling you to analyze ThreatStream intelligence and also monitor key security metrics of your organization such as user activity, network traffic, asset usage, and customer information (requires Security Analytics subscription). You can customize visualization types and define AQL queries that power dashboard panels across multiple tabs, allowing for targeted security data analysis aligned with your organizational objectives.
A dashboard comprises panels, rows, and tabs.
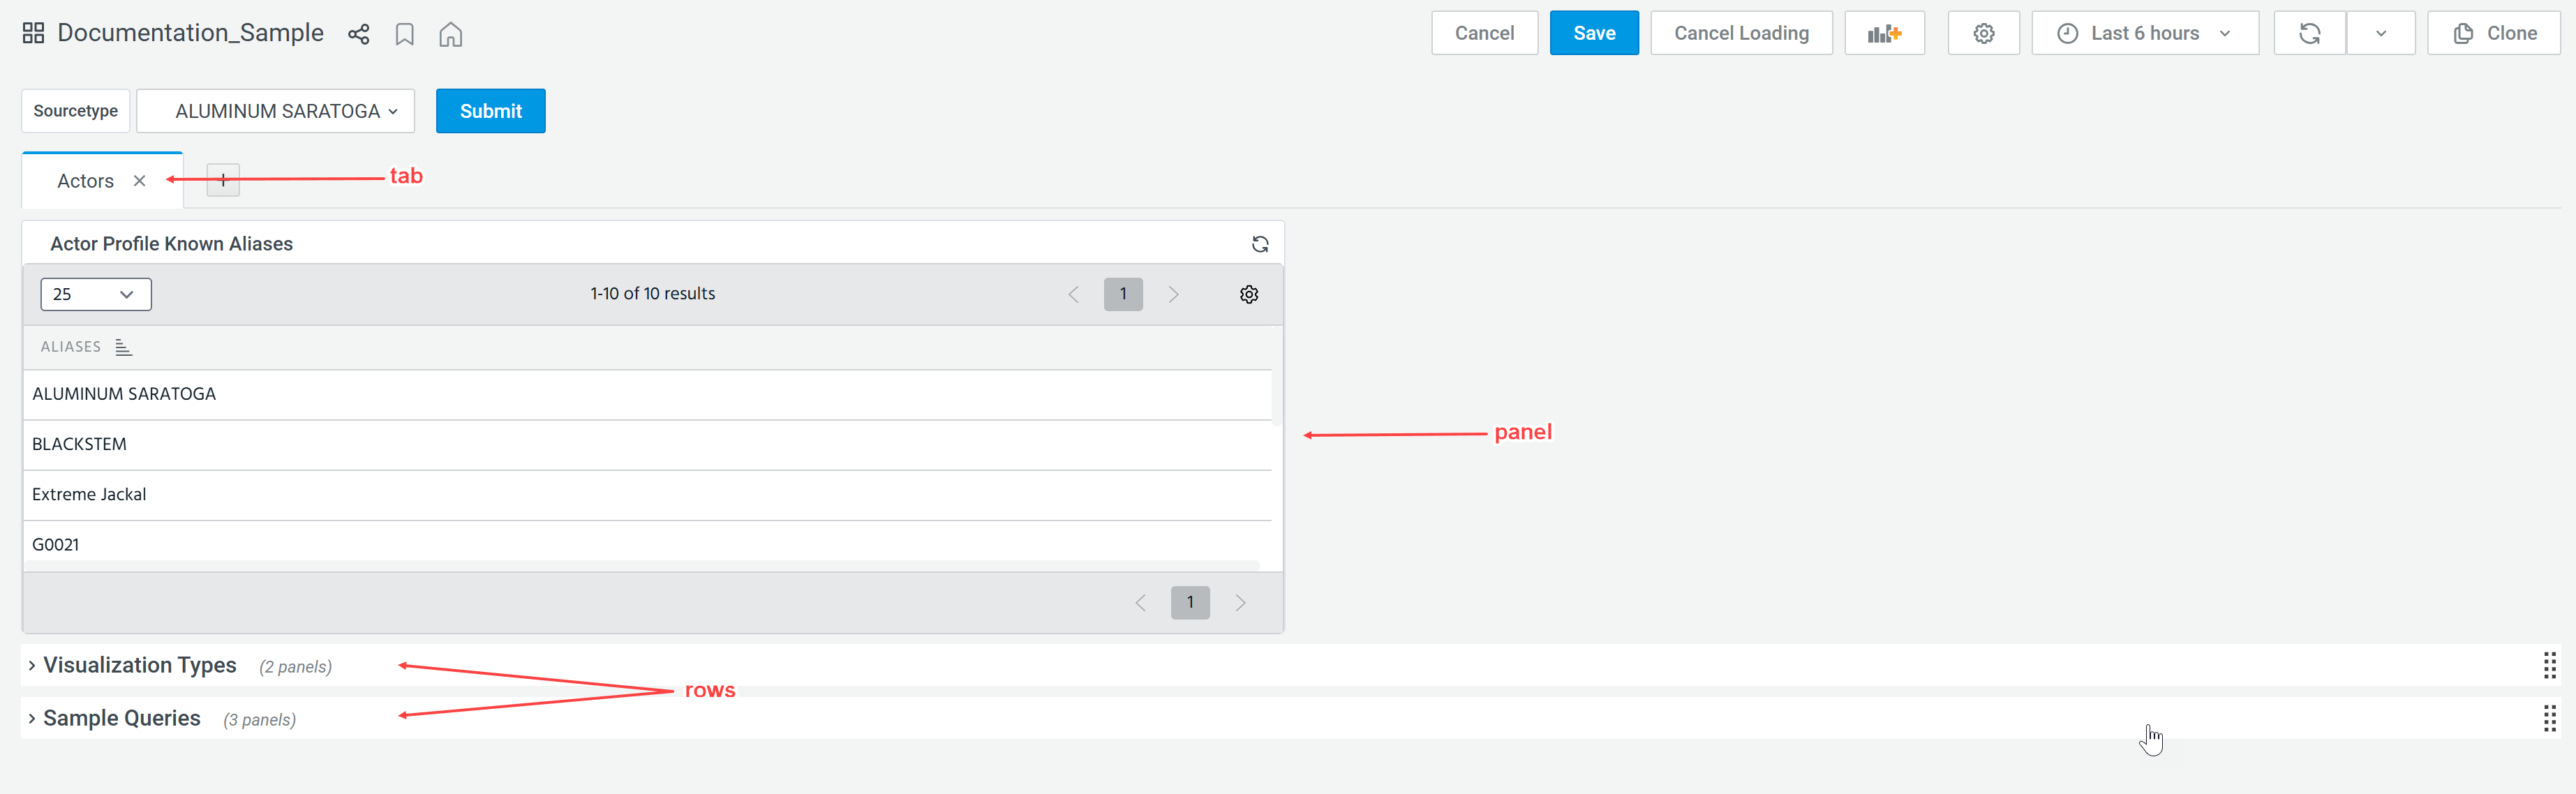
For details about panels, refer to Dashboard Panels.
For information on how to add panels, rows, and tabs to a dashboard, refer to Managing Dashboards .
Managing Custom Dashboard Permissions
All users can create dashboards. Users who create a dashboard become the owner of that dashboard. Access to each dashboard is managed by the dashboard owner under the Sharing & Permissions tab of the dashboard or in Dashboard Settings. See Creating Dashboards and Configuring Dashboard Settings for details.
If the Sharing & Permissions settings are configured as follows:
-
Private—Only the dashboard owner can view and edit the dashboard.
-
Shared—Users with specified roles can view and edit the dashboard according to their assigned permissions.
Users with roles granted read permissions:
-
Can view, clone, and export (PDF only) dashboards.
Users with roles granted write permissions:
-
Can clone, share, and export dashboards.
-
Can edit the dashboard metadata (name, description, and tags) and layout.
-
Cannot change dashboard ownership and permissions.
Users who own the dashboard:
-
Can perform all actions, including editing ownership and permissions of the dashboards they own.
Organization Administrators:
-
Can perform all actions, including editing ownership and permissions of any dashboard.
Dashboard Panels
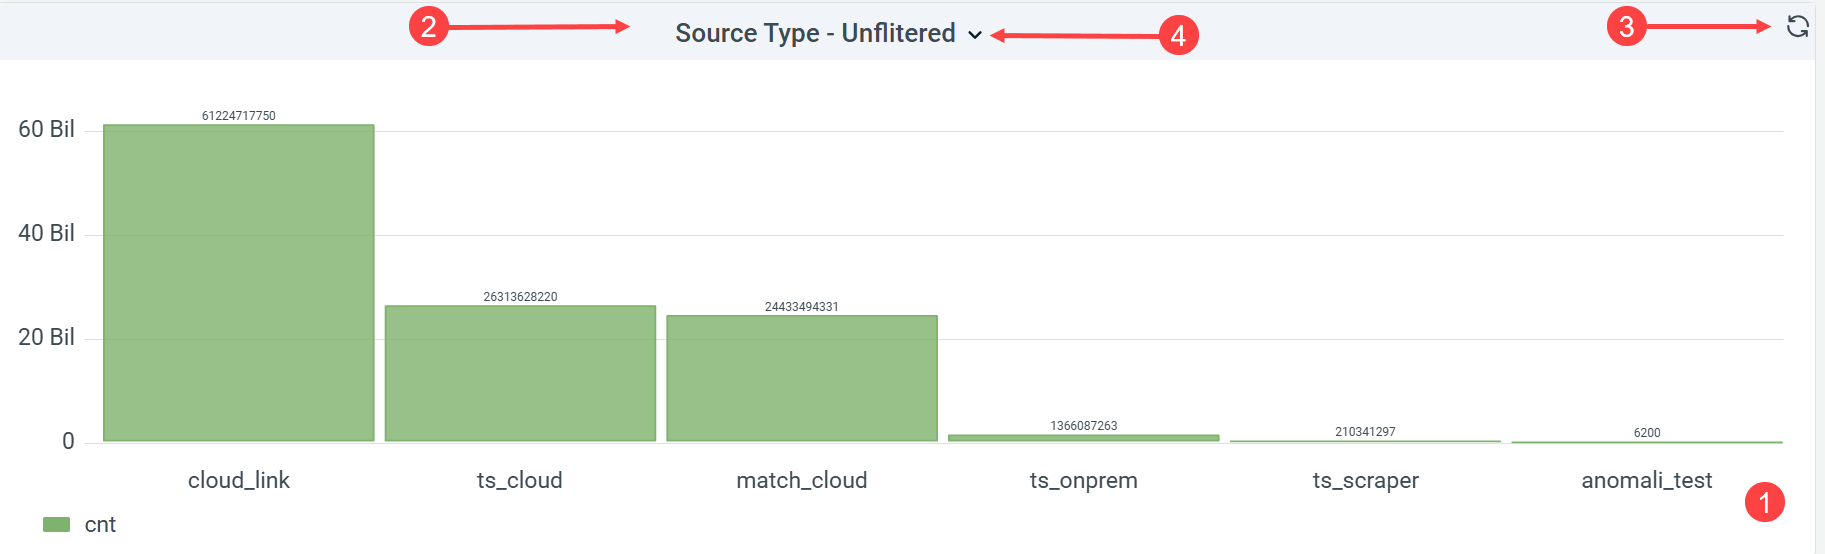
A panel contains a visualization of event search query results. There is no limit to the number of panels that can be added to a dashboard. However, the number of panels, the amount of data, the time range, and the refresh rate are factors that impact the time it takes panels to be updated.

|
Visualization: Visualization type of the panel. Refer to Visualization Types for more information. |

|
Panel Title: A panel title can be modified in panel settings. See Editing Panel Settings for details. |

|
Panel Refresh: Click  to force panel refresh. to force panel refresh. |

|
Panel Management: Mouse over the space to the right of the title and click the expander to display the panel management menu, which has options to Open in Search, View, Edit, Share, Inspect the panel, Copy, or Duplicate. Refer to Managing Dashboard Panels for details. |
Dashboard Actions
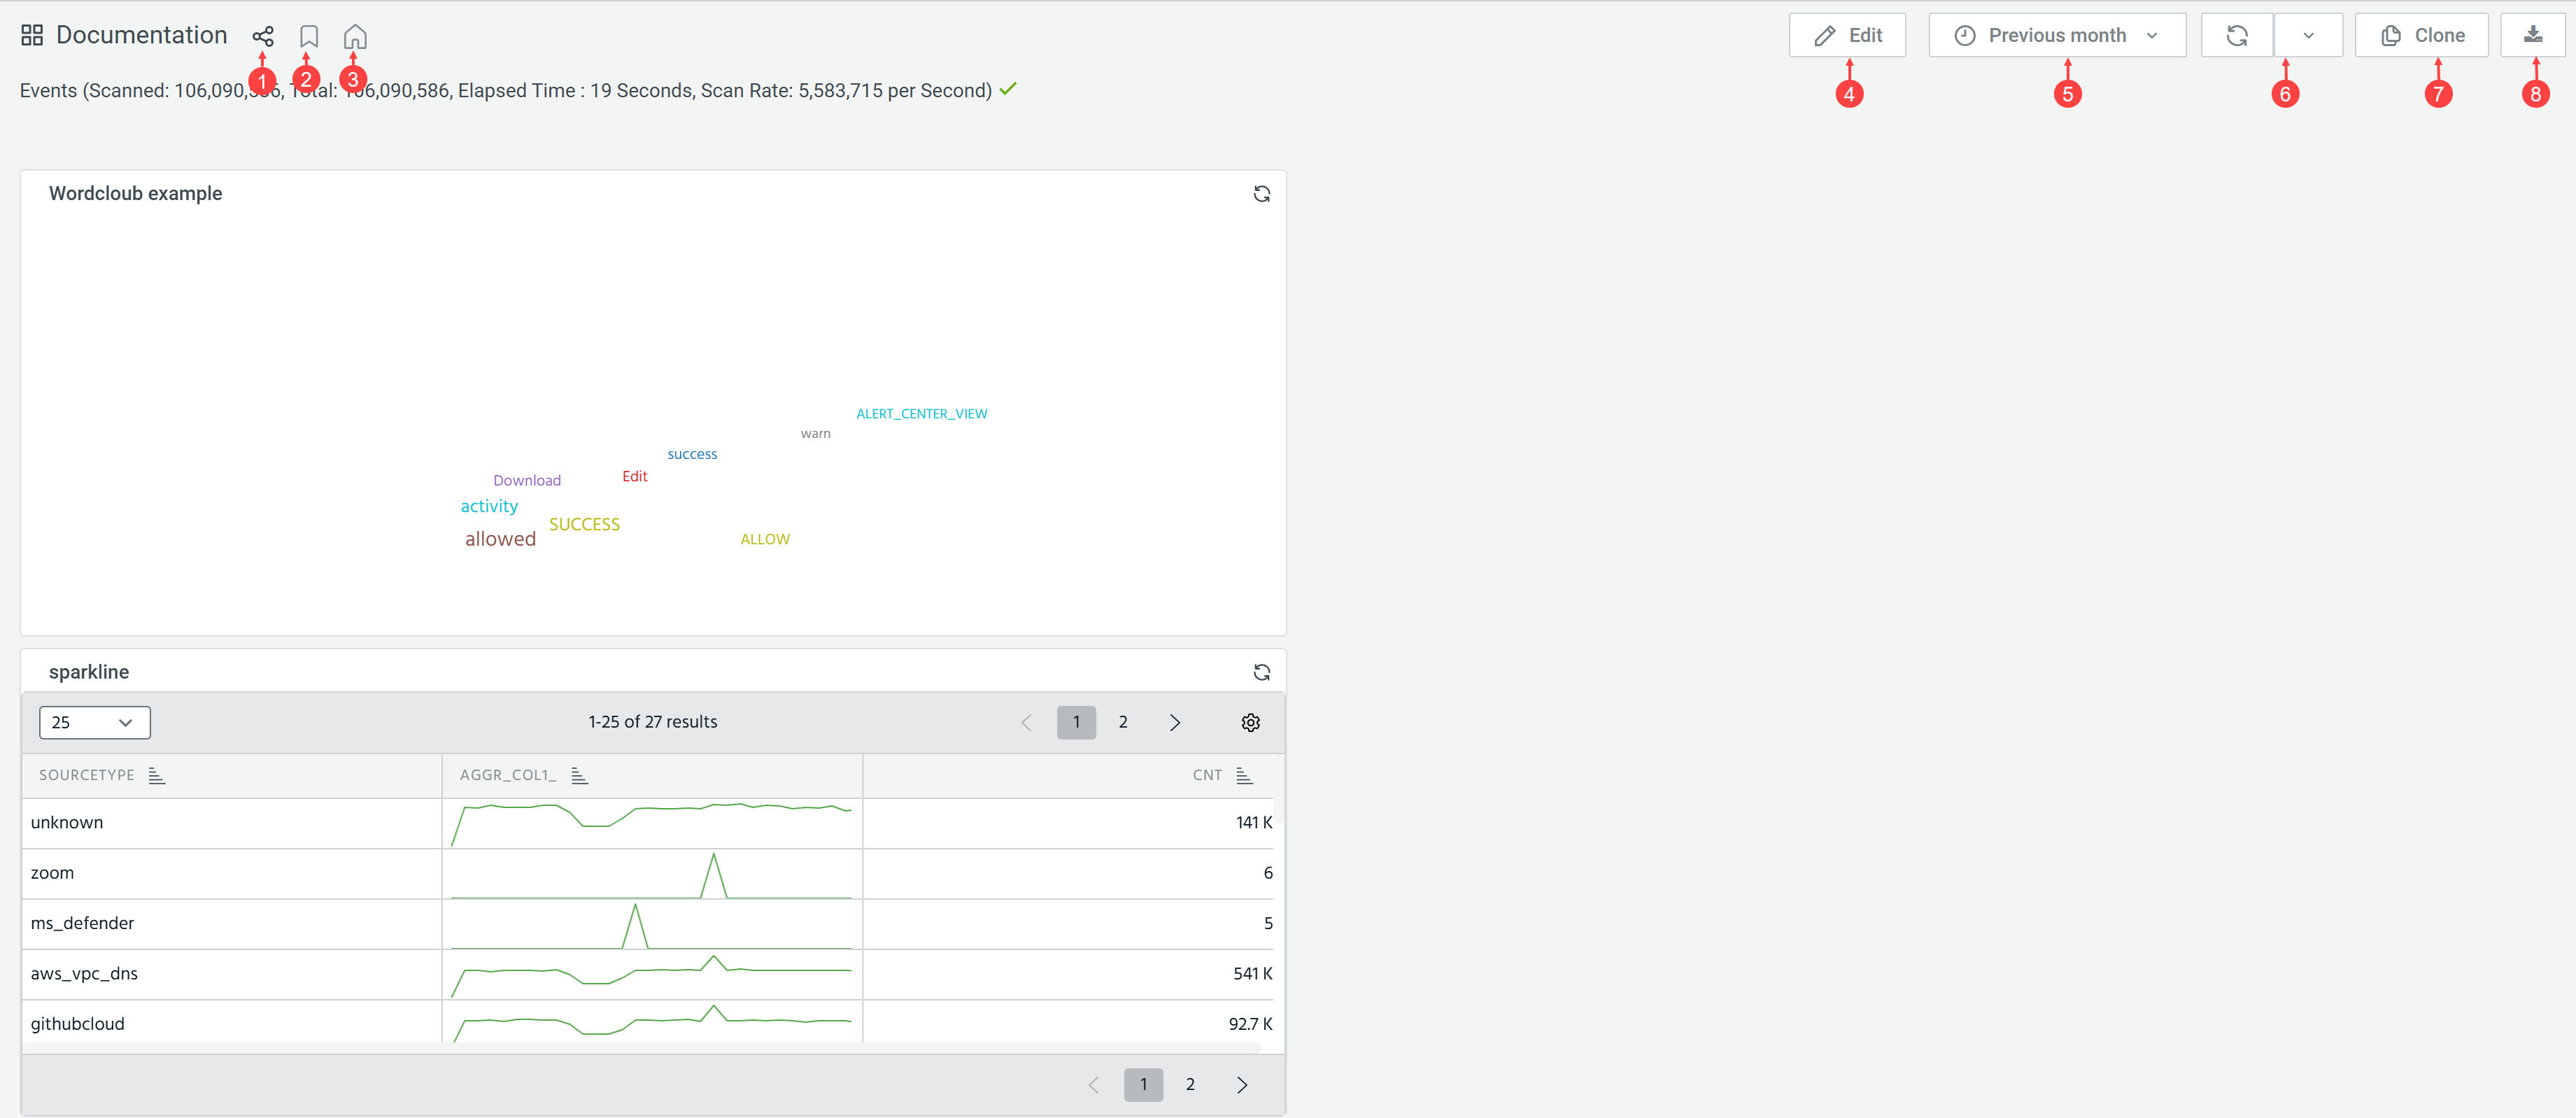
From all dashboards, including custom dashboards, you can perform a number of actions. Refer to the image and table below for details.
|
|
Share the dashboard by copying the dashboard URL or exporting it in JSON format. See Sharing Dashboards for details. |
|
|
Bookmark the dashboard by marking it as a favorite. All your bookmarked dashboards can be found in the Bookmarked section of the Dashboard menu. To remove a dashboard from your bookmarks, click the bookmark icon. |
|
|
Designate the current dashboard as your primary dashboard. The setting is saved per user, so each user in the organization can designate their own primary dashboard. The name of the primary dashboard appears as the first item in the Dashboard menu. |
|
|
Edit the dashboard. Click Edit to perform the following actions:
|

|
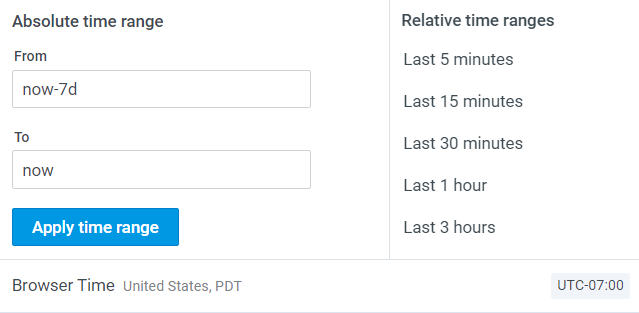
Select a time range for the data displayed on the dashboard. You can select an absolute time range or a relative time range. By default, data for the last 7 days is displayed.
|

|
Select a time range for refreshing the dashboard. Select Off if you don’t want to refresh the dashboard. Click |

|
Clone the dashboard. See Cloning Dashboards for details. |

|
Export the dashboard in PDF or HTML formats, and create scheduled reports. |