Exploring Search Results and Refining Queries
The Search interface provides multiple options to gain deeper insight into your search results and refine your search query.
Exploring Search Results
Note: For OCSF schema fields, array indexes start at array[1] and not array[0].
A typical Search — whether based on the eventlog or OCSF Version 1.2 schema — produces results that you can inspect as follows:

-
Hover your mouse on the search result and click the View Detail (
 ) icon to open the Event Inspector side panel and view the details about that particular result row.
In the example screenshot above, the Event Inspector side panel displays the Event ID, the different fields related to the search result, and the Search Event field that lets you search for a particular field by text. You can also add a field to your search query, exclude a field from your search query, or launch a new search with a field. Click the Download CSV icon (
 ) to download the result as a CSV file.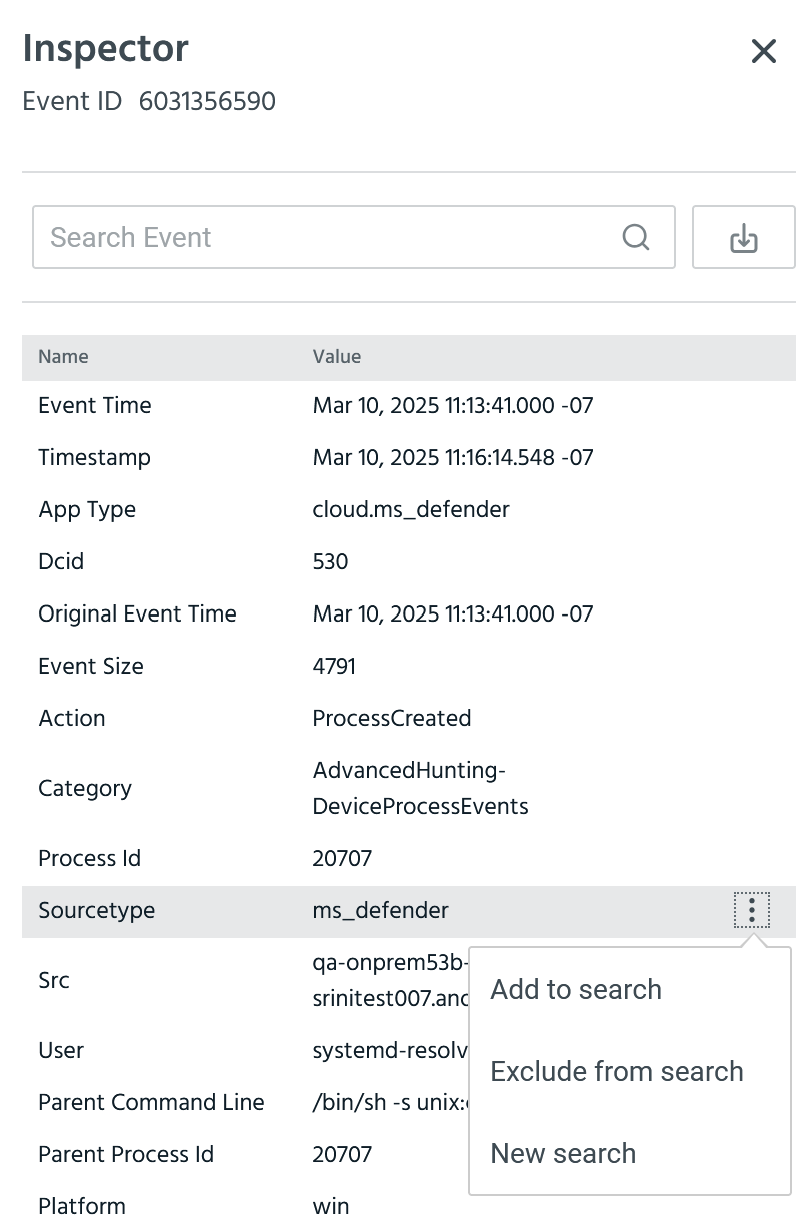
-
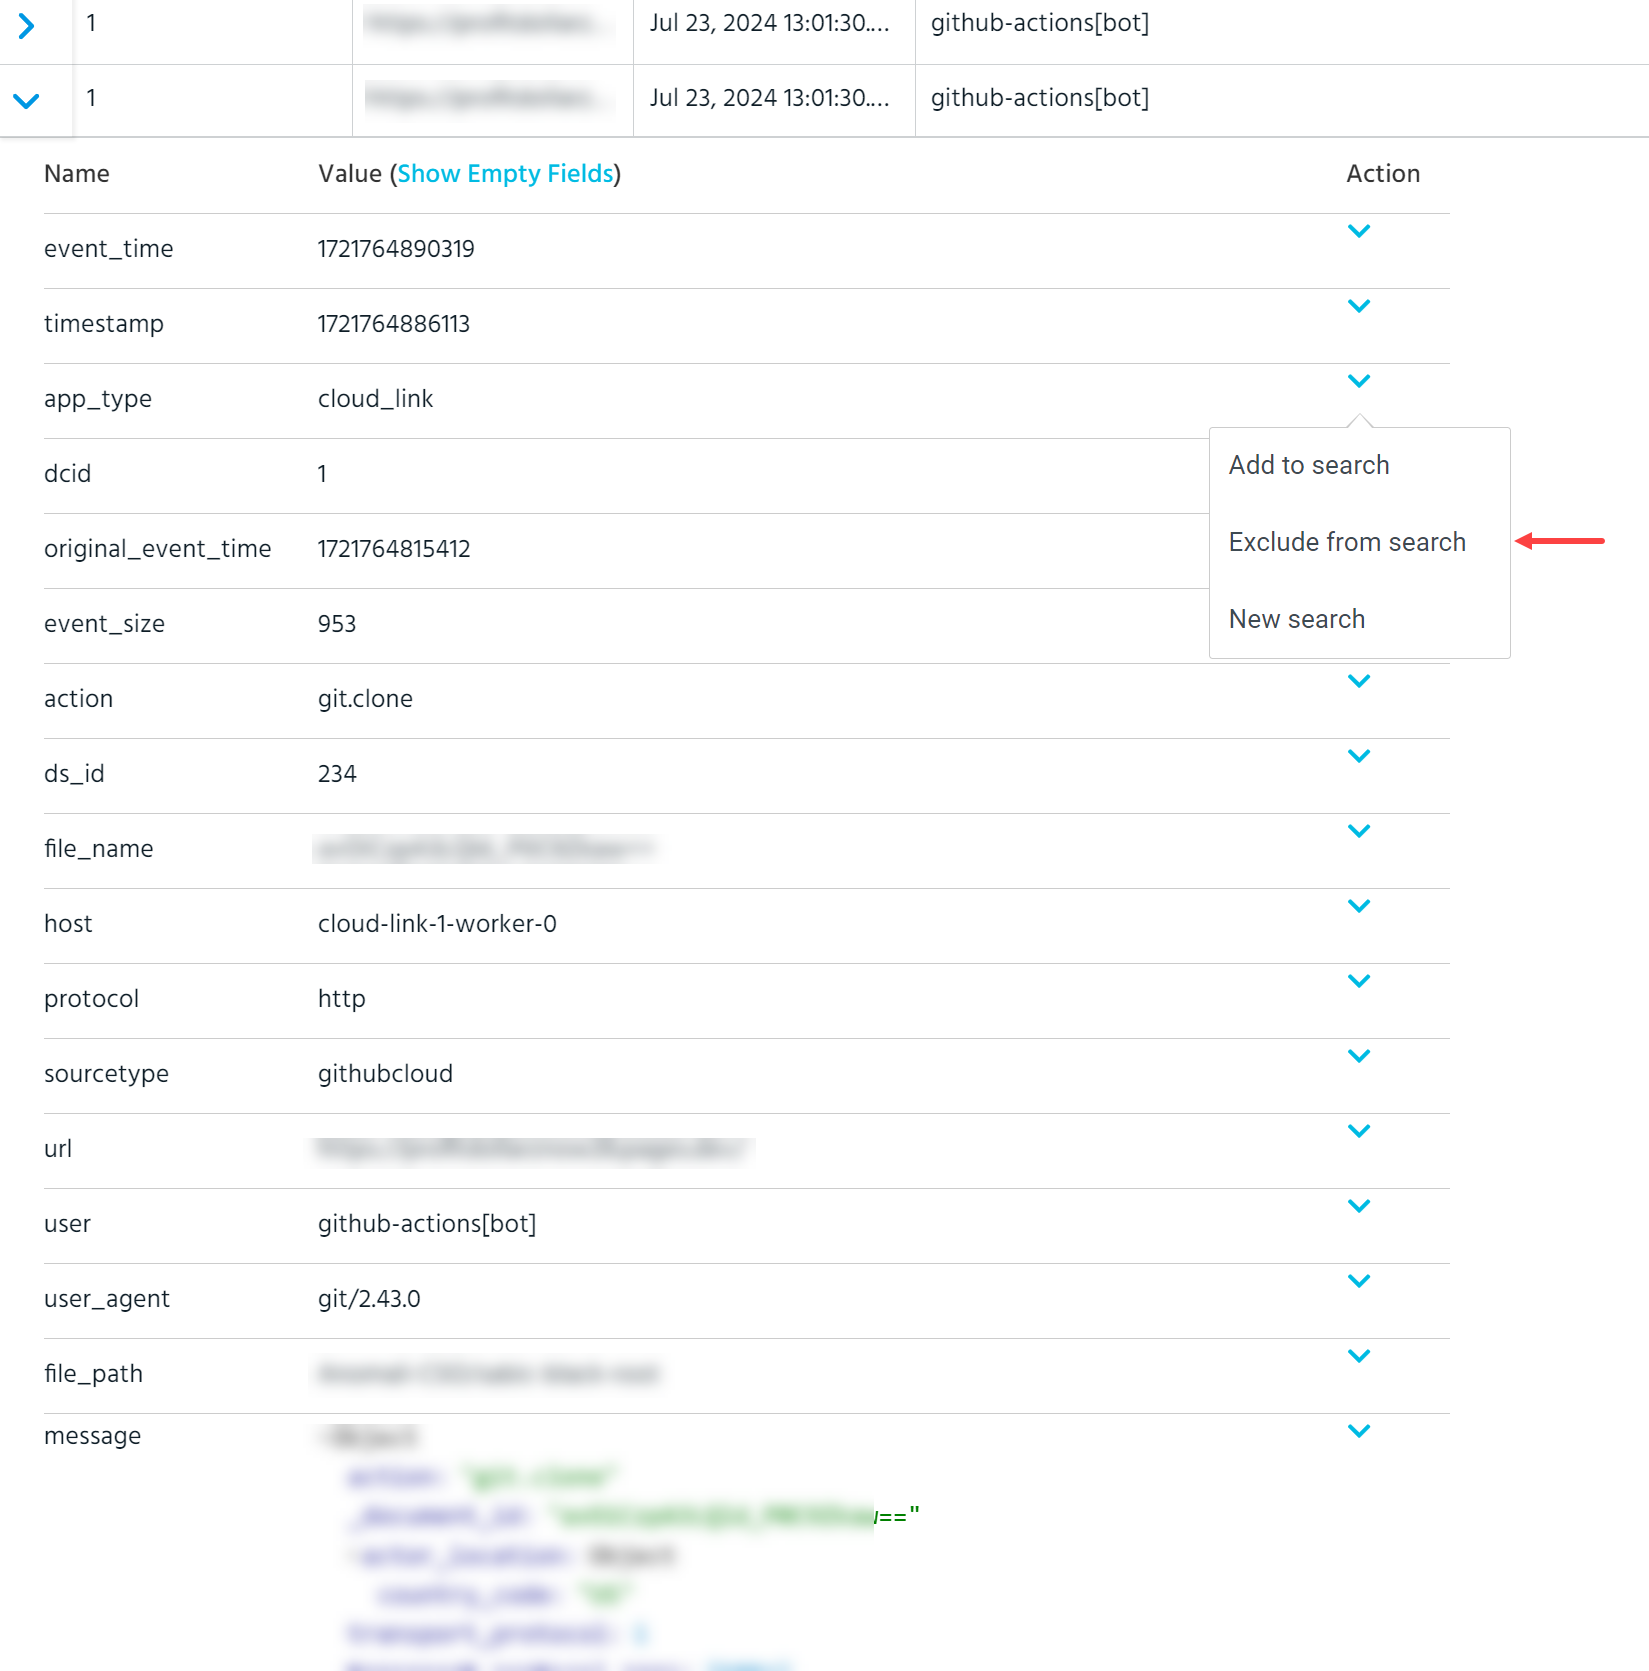
Click the
 icon on the left side of the row to expand its details. In the expanded row, click the
  icon on the right side to display the Field Values filter menu. The following example shows the Field Values filter used to exclude results for a specific
 app_typefield value. As a result, the field-value pair to exclude is added to thewhereclause in the search expression. Click to issue the new search with the field excluded.
(Click the image to enlarge it.)
Note: The user interface elements for refining queries are not available after you submit a query using the aggr or timetrend operators because the results for those queries are aggregations.
Refining Search Expressions
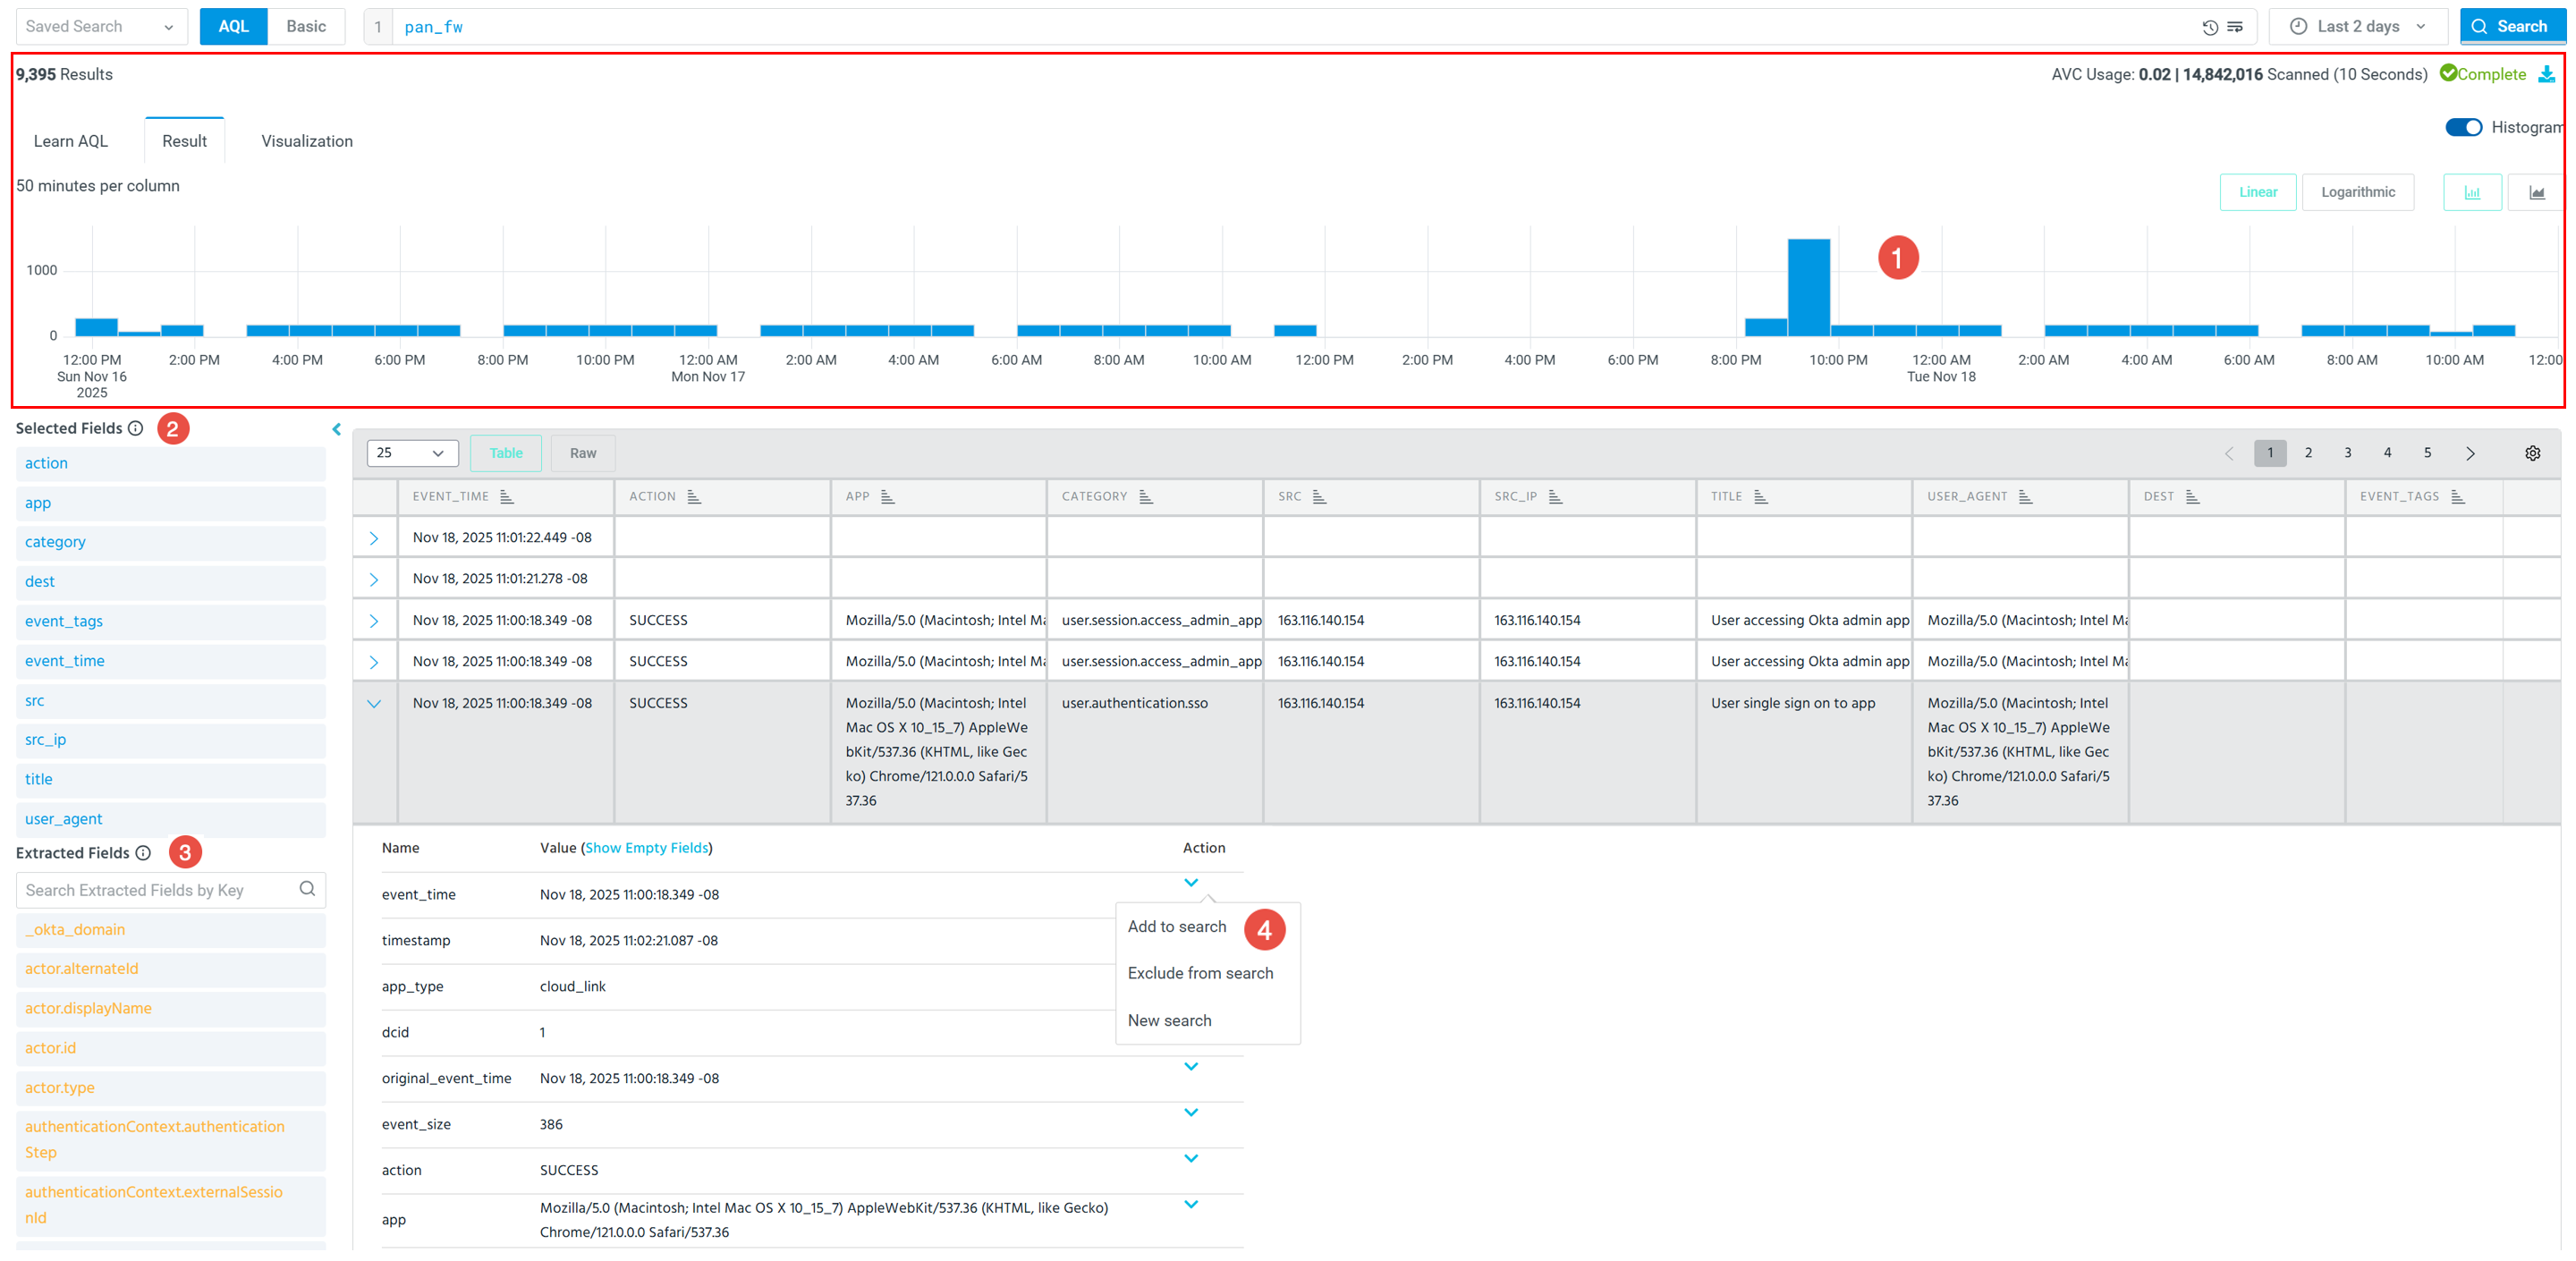
The Result tab displays Search results as a paged table. Review results and add filters to further refine your search and set fields to display in a search visualization in the Visualization tab.
(Click the image to enlarge it.)

|
Time Series: The graph plots results over time. You can display the time series graph as a bar graph, a line graph, or points. If you click and drag over the graph elements (bars for example), the time range selector updates to the selected range and accordingly issues a new search. |

|
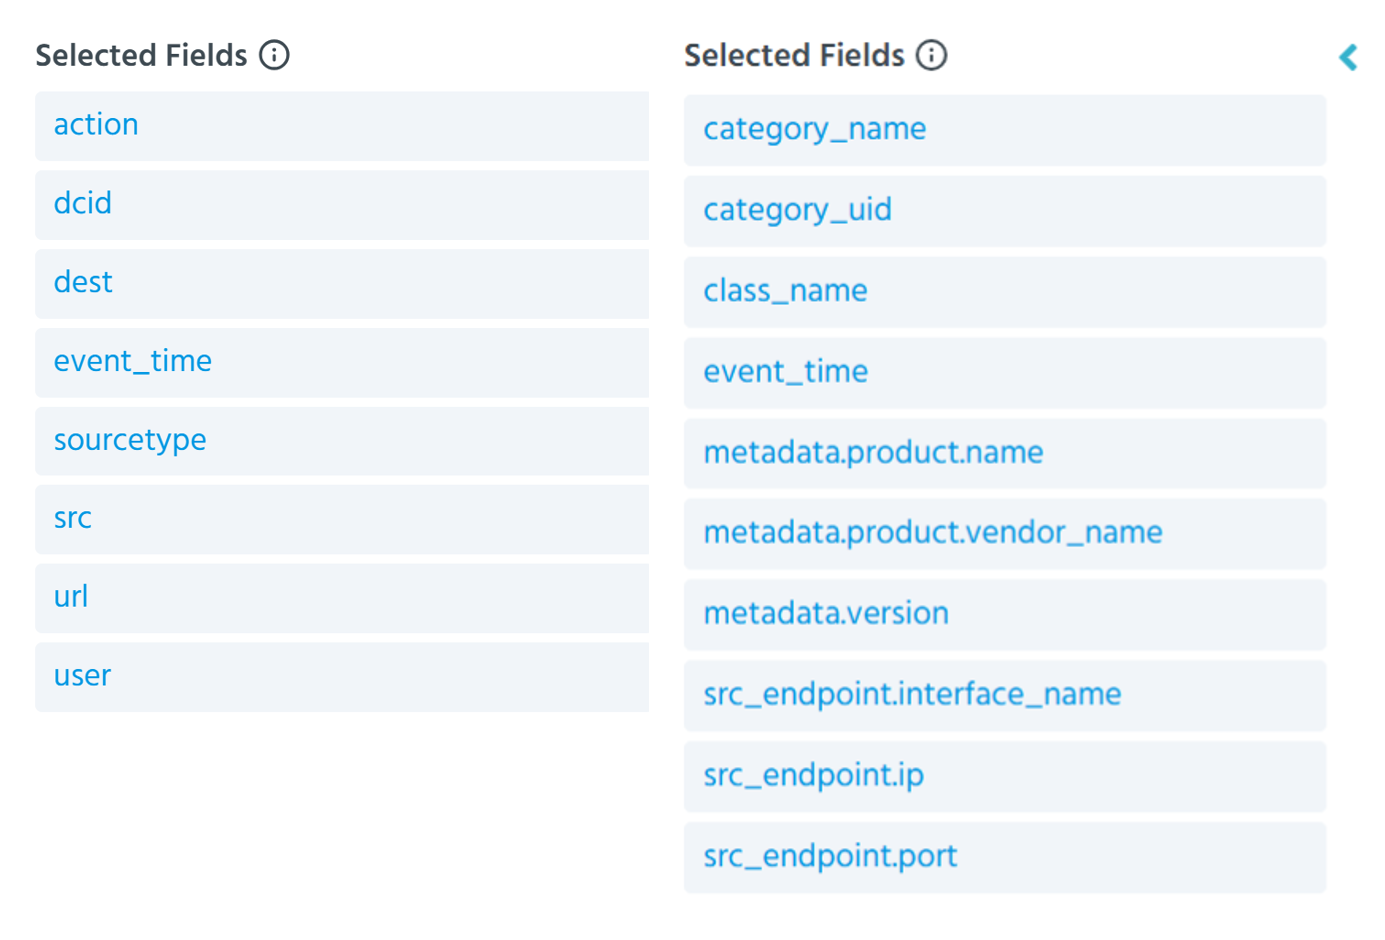
Selected Fields: These fields are schema fields that are currently chosen for display in the results grid. As shown in the example screenshot below, depending on your query, these could be eventlog fields or OCSF Version 1.2 schema fields. OCSF Field Extraction Note: For OCSF schema fields, array indexes start at
When Schema RBAC is active for your organization, the schema filters in your assigned roles determine which data this feature returns. An eventlog filter limits your results to only the eventlog data your role permits, and an OCSF filter limits your results to only the OCSF data your role permits. If a query runs against a schema for which your role has no filter assigned, the query returns a forbidden error. For details, see Role-Based Access Control for Schemas. Using the Pane Statistics The Selected Fields pane displays statistics about the event fields, including:
On the pane:
|

|
Extracted Fields: Contains all the fields that are automatically extracted from the raw message (JSON, CEF, or key-value pairs). The benefit of such on-the-fly extractions is that it enables analysts to rapidly and flexibly view and use these extracted fields in AQL queries to conduct downstream analysis across different Anomali applications, even if they are not normalized into eventlog schema fields. You can also search for an extracted field by key and analyze an extensive list of fields extracted directly from the raw message. See Dotted Notation to understand how you can use these extracted fields in your searches.
|

|
Event Field Values: Click the In an expanded row, click the
|
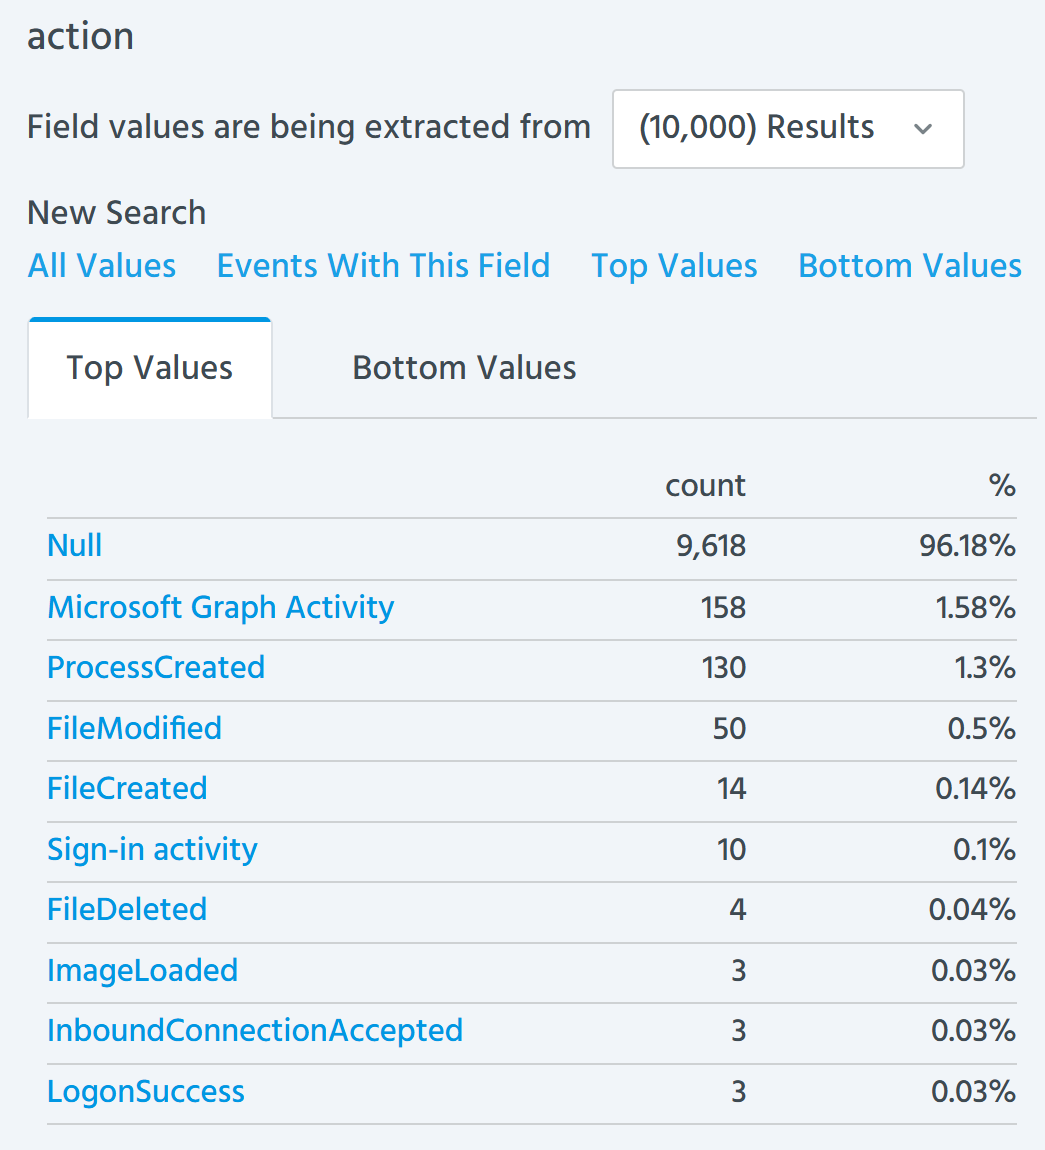
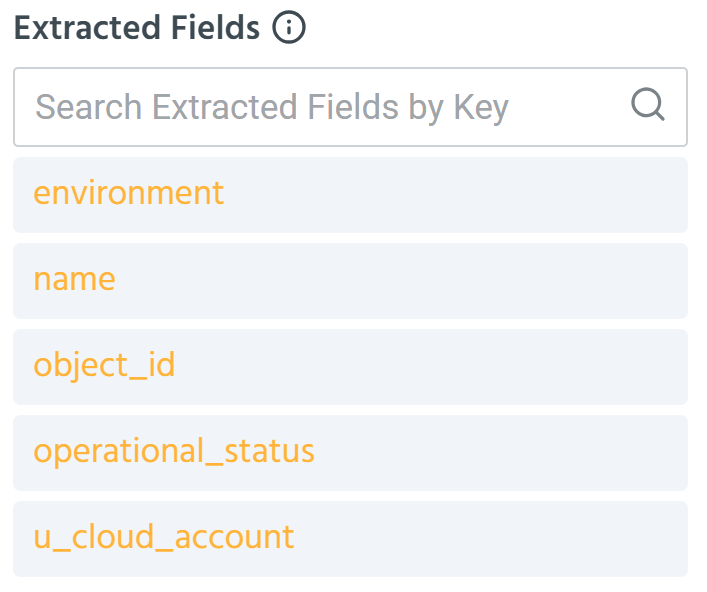
OCSF Field Panel
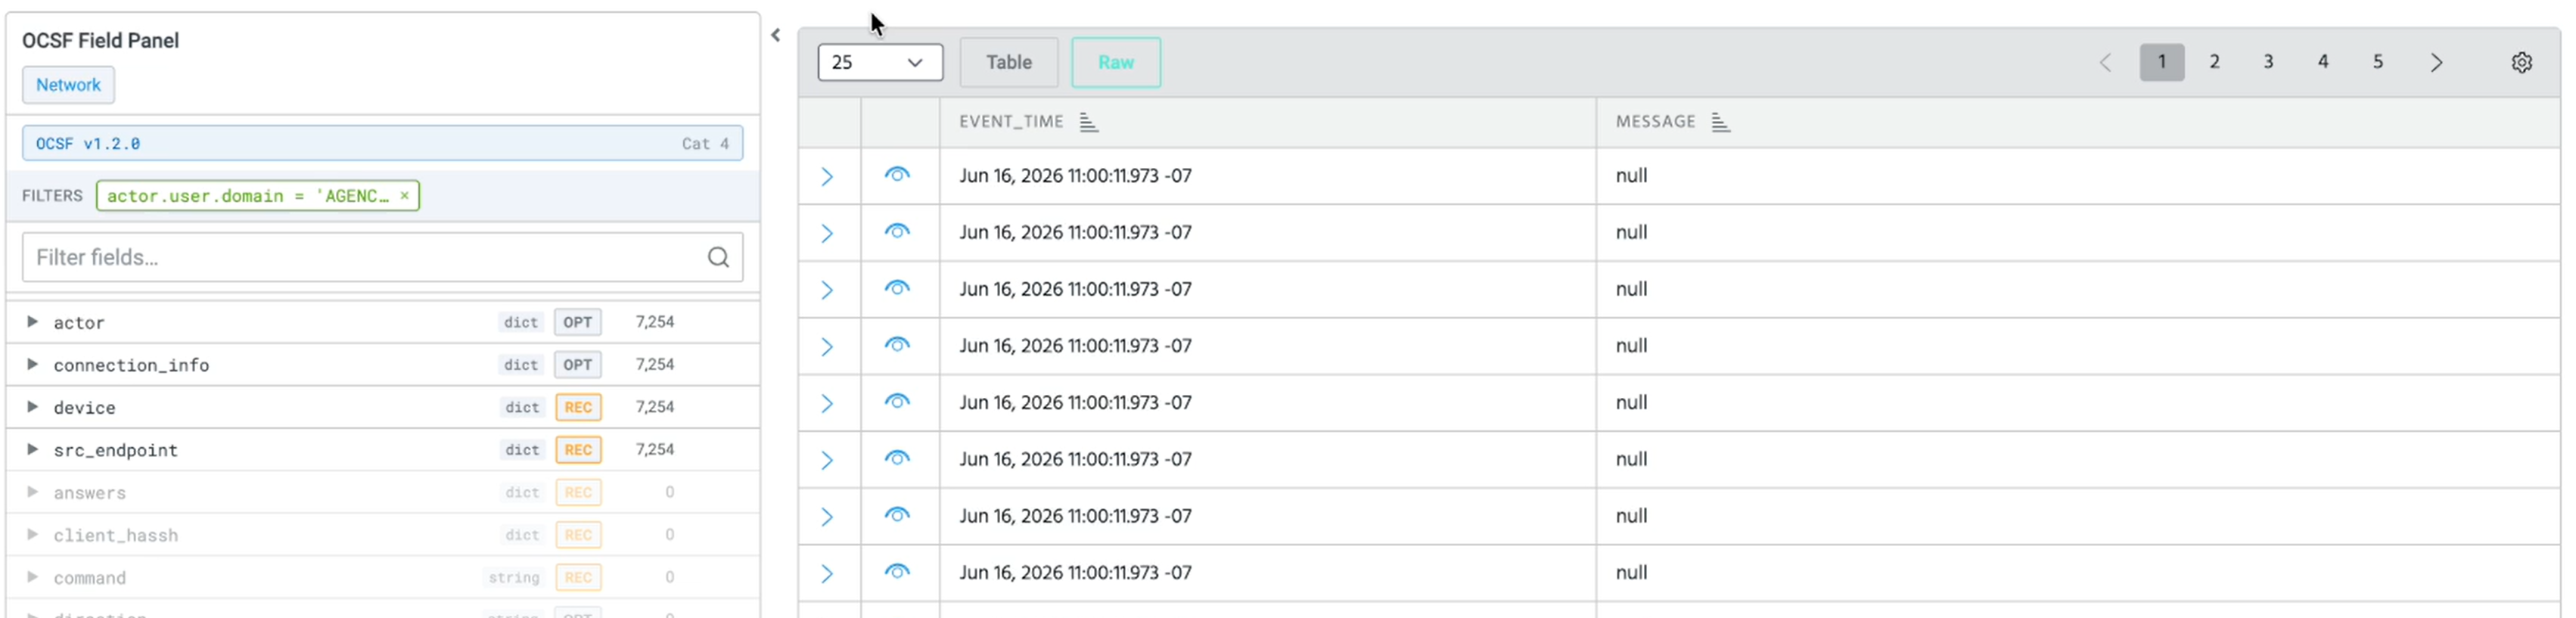
The OCSF Field Panel is a collapsible sidebar on the left pane of the Event Search page. When you run an OCSF search, the panel lists the schema fields for the active OCSF category, shows how many events in your current result set have each field populated, and lets you add include or exclude filters to your active query by clicking, without typing field names manually in the search bar.
Note: The OCSF Field Panel is available only when you are searching OCSF data. Prefix your query with ocsf to search OCSF events. See OCSF Schema Overview for more information.
(Click the image to enlarge it.)
OCSF Field Panel
The OCSF Field Panel contains the following elements.
-
Category tab: Indicates the active OCSF Version 1.2 category.
-
OCSF v1.2.0 / Cat N: The schema version and the numeric identifier of the active category.
-
Filters: Displays the filter conditions currently active in your query.
-
Filter fields: Type to narrow the field list by field name.
-
Field list: Lists the OCSF schema fields for the active category, along with their data type, requirement level, and hit count.
Category Tabs
The OCSF Field Panel groups fields by the six top-level OCSF Version 1.2.0 categories.
| Tab Label | Category Number | OCSF Category |
|---|---|---|
| Sys | 1 | System Activity |
| Findings | 2 | Findings |
| IAM | 3 | Identity & Access Management |
| Network | 4 | Network Activity |
| Discovery | 5 | Discovery |
| App | 6 | Application Activity |
The OCSF Field Panel appears only when your active query filters on exactly one OCSF category using category_name. The panel displays the fields for that category and the tab for the matching category is active. If your query specifies no category filter, or more than one category, the search runs as a standard OCSF search and the OCSF Field Panel is not displayed.
Field List
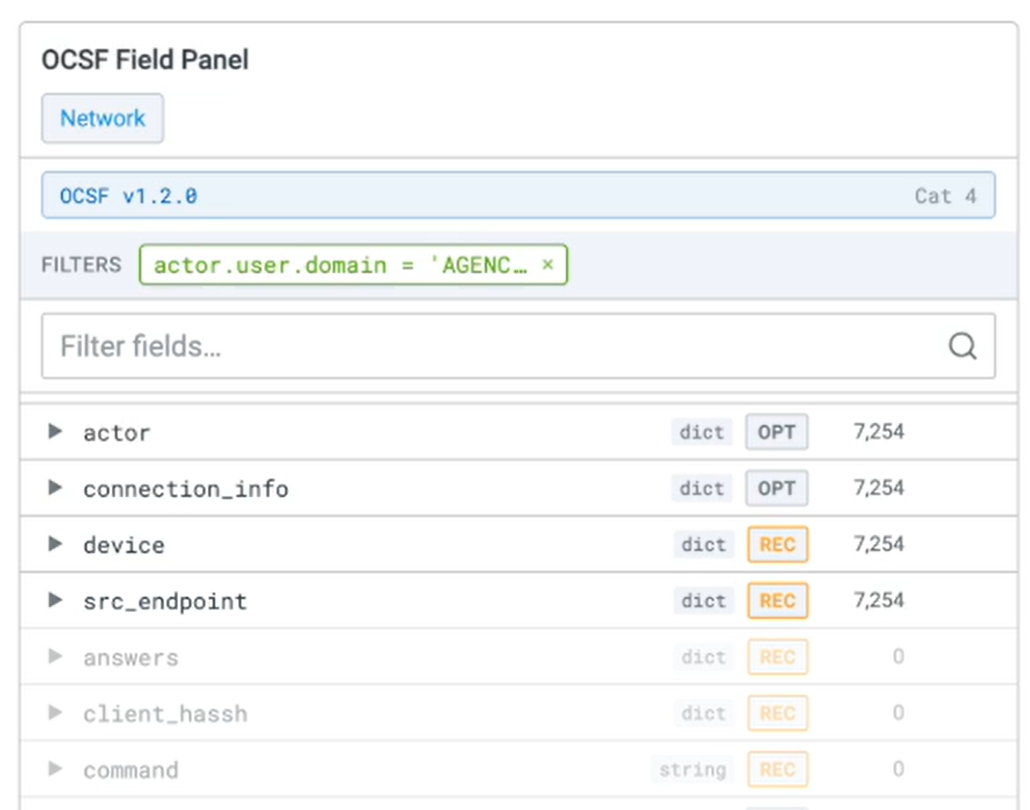
Each row in the field list displays the following information:
-
Click ▶ to expand the field and view its description. Click ▼ to collapse.
-
The field name in dotted notation, for example,
src_endpoint.iporactor.user.name. -
The field data type, for example,
dict,string, ornumber. -
The requirement badge: REQ (Required), REC (Recommended), or OPT (Optional).
-
The hit count: the number of events in the current result set that have this field populated.
Fields with no hit count are dimmed but remain visible, so you can discover all available schema fields for the active category.
Expanding a Field
Click ▶ next to a field name to expand the row and view the field description from the OCSF schema. Click ▼ to collapse the row. Expanding a field does not trigger any additional data requests.
Field Value Distribution
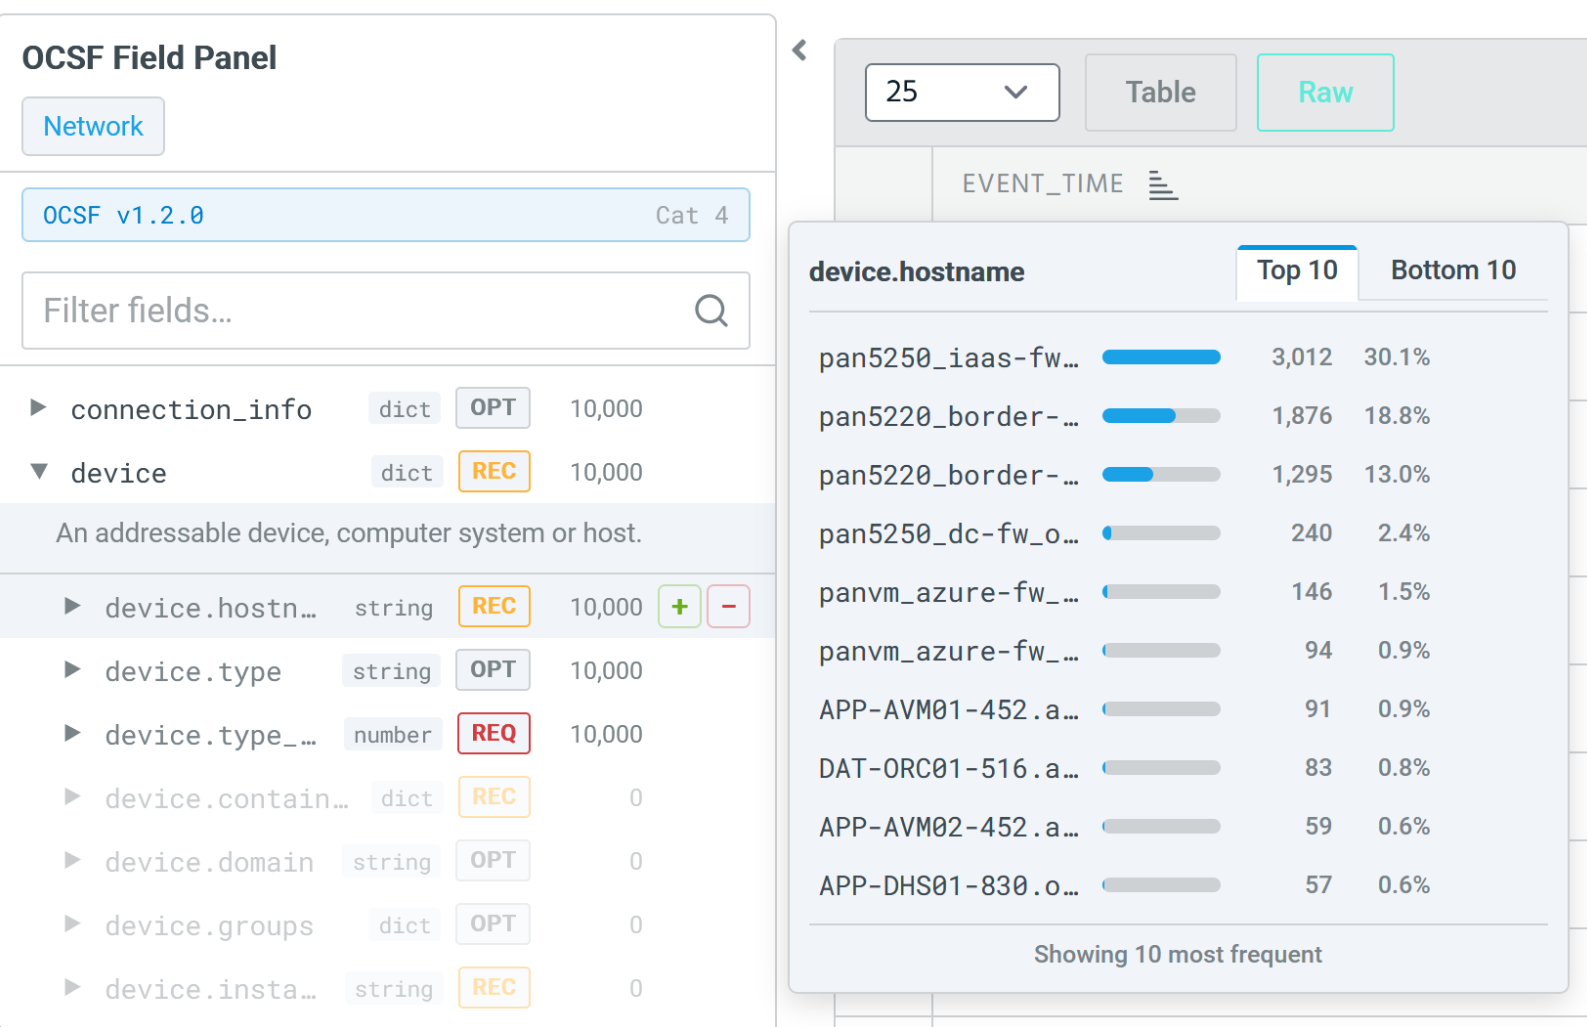
Hover over a field row to open the field value distribution. The panel has two tabs:
-
Top 10 (default): The 10 most frequently occurring values for this field in the current result set, ranked in descending order by event count.
-
Bottom 10: The 10 least frequently occurring values for this field in the current result set, ranked in ascending order by event count.
Each value row displays the value, a proportional bar, the event count, and the percentage of the result set. Click + or − on a value row to add an include or exclude filter for that specific value.
Filtering the Field List
Type in the Filter fields box at the top of the panel to show only the field rows whose names contain the text you enter. Clear the box to restore the full field list for the active category.
Click-to-Filter
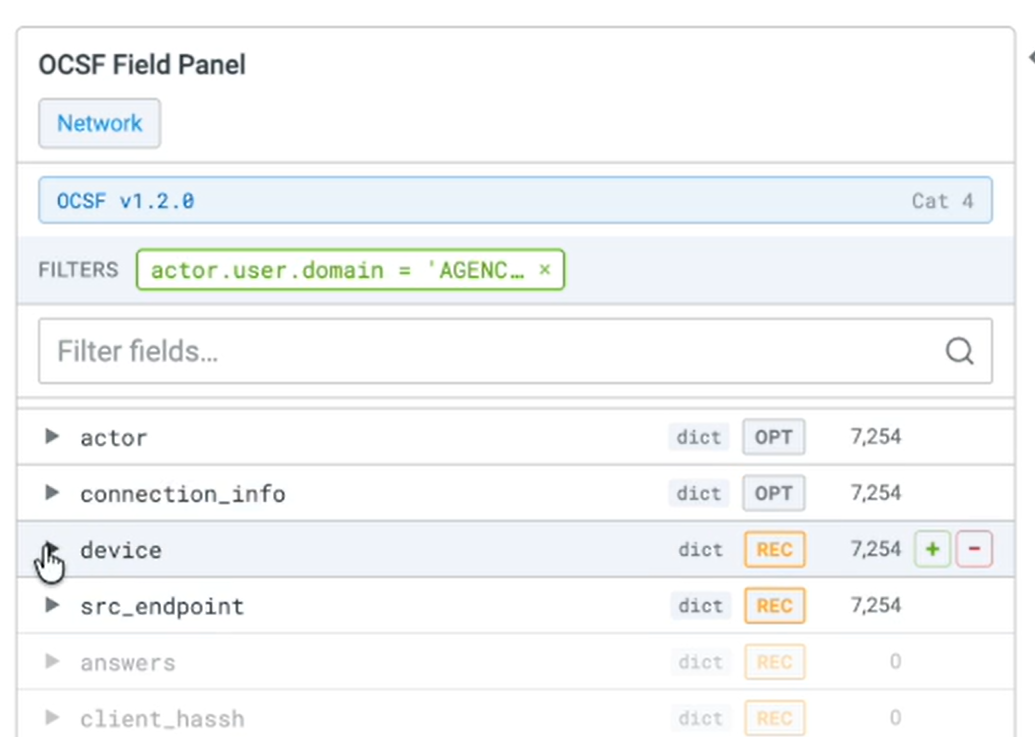
Hover over a field row to reveal the + (include) and − (exclude) action icons. Clicking either icon appends a filter clause to your active query and re-executes the search automatically. The following table describes the clause generated for each action:
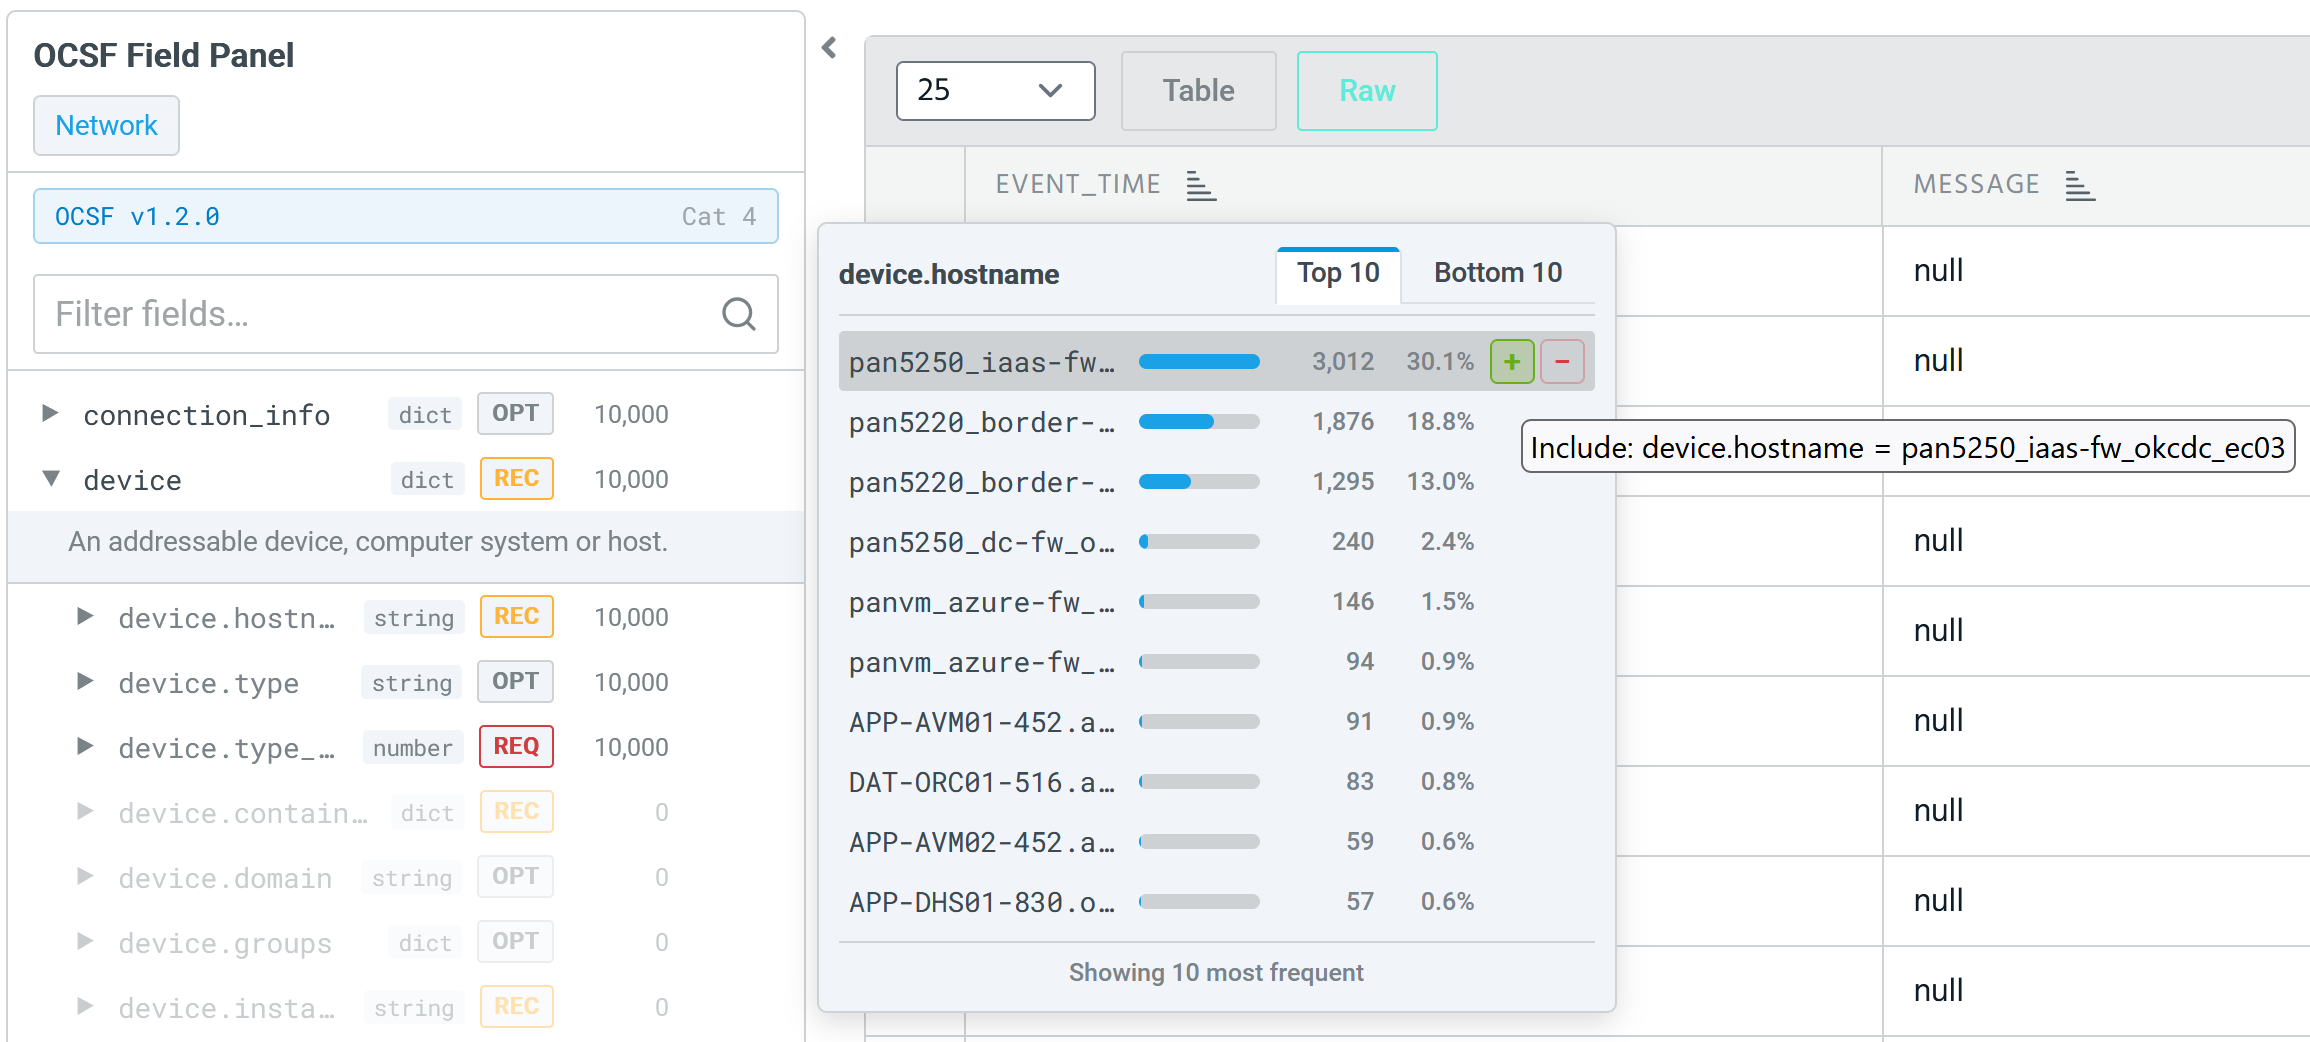
| Action | Generated Query Clause | What it means | Example |
|---|---|---|---|
| Click + on a field | AND field_name:*
|
Show only events where this field has any value populated. | AND src_endpoint.ip:*
|
| Click + on a value | AND field_name:"value"
|
Show only events where this field equals this specific value. | AND src_endpoint.ip:"192.0.2.1"
|
| Click − on a field | AND NOT field_name:*
|
Exclude all events where this field has any value populated. | AND NOT src_endpoint.ip:*
|
| Click − on a value | AND NOT field_name:"value"
|
Exclude all events where this field equals this specific value. | AND NOT src_endpoint.ip:"192.0.2.1"
|
If the query bar is empty when you apply a filter, the leading AND is omitted. The applied filter also appears in the query bar so you can view and edit the full query. To remove an applied filter, click its active icon again, which removes the clause and re-executes the search. When a filter is active, the field row + icon turns green for an include filter and the − icon turns red for an exclude filter, so you can see at a glance which fields have filters applied.
Building the Fields List
Note:
-
Field names and aliases are case-insensitive. Field values and string literals are case-sensitive.
-
For example, both the following example queries return the same results.
Query 1: |where sourcetype != "" |calc Date = strftime(event_time, '%Y-%m-%d')
Query 2: |where sourcetype != "" |calc date = strftime(event_time, '%Y-%m-%d')
To facilitate hunting, you can customize the columns displayed in the results table and specify the sort order. The fields list determines the columns that appear in the results table. You can type a fields list in the search bar or use the Field Name selector to build it. The sort clause specifies the field to sort on and the sort order (ascending or descending).
You can also embed a subsearch in the primary search to create efficent and dynamic search queries that can perform correlations across multiple datasets. See Subsearch for more information.
Aggregating, Sorting, and Limiting Result Rows
You can use the aggr operator in a search query to perform counts and sort the aggregated rows by count, gaining insight into the comparative prevalence of field values, as shown in the example below. The sort and limit operators are used to further refine the result set.
From the aggregated results, you can click a hyperlinked value to issue a new search that has the selected value as the where operator filter.
You can also drill down on aggregations performed on multiple fields.

In the example above, clicking the hyperlinked aggregated value 160 in the Aggr_Counts column drills down into that specific aggregation and issues a new search with app=xdr-alert-action-azure and category=xdr.
You can also embed a subsearch in the primary search to create efficent and dynamic search queries that can perform correlations across multiple datasets. See Subsearch for more information.
Using Search History
Search saves your 10 most recent searches.
To issue a search from your search history:
-
Click the Search history icon (
 ) to display the list.
 -
Select a query to run the search with the previous AQL syntax and absolute time range.
Exporting Search Results
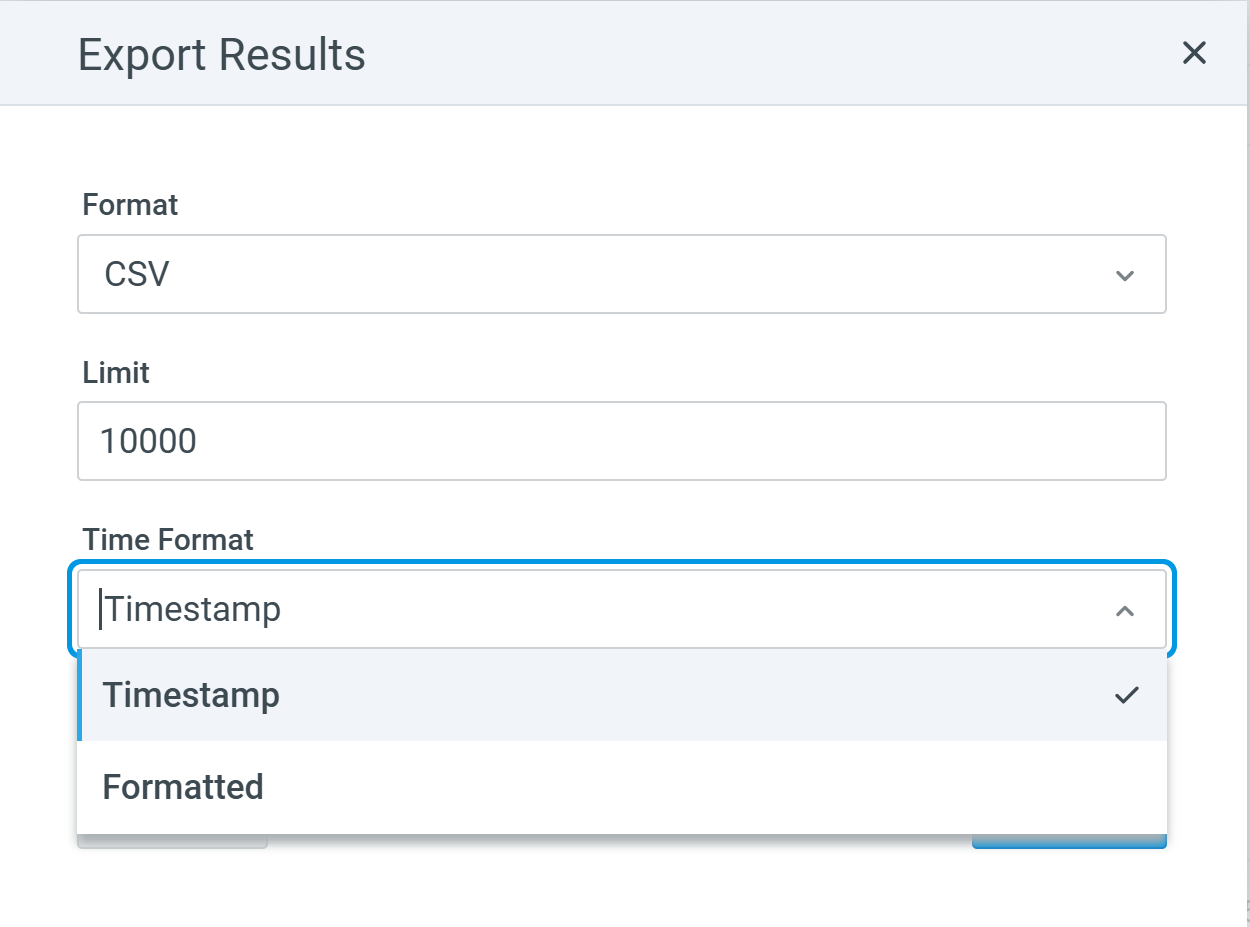
To export event search results:
-
On the Search results page, click Export (
 ).
). -
In the Export Results dialog box:
-
Select CSV or JSON as the export format.
-
Enter the maximum number of search results you want to export. The default limit is 10,000.
-
Select the date and time (in UTC) format for the exported results, as captured in the
event_timefield:-
Timestamp—Export date and time values as UNIX timestamps. For example,
1776465184000is the UNIX timestamp for the exported result. -
Formatted—Export date and time values in a human-readable date-time format. For example,
2026-04-17 10:37:19 PMis the equivalent human-readable time format for the exported result.
-
-
-
Click Submit to initiate the export.