On this page:
Related topics:
Detections
The Detections page displays the entire catalog of signals produced in your environment when the platform identifies a specific behavioral pattern, policy violation, or threat indicator within log data. These signals are organized by detection rules created on the platform and are grouped for quick review, enabling you to monitor detection volume across severity levels, investigate matched entities, and act on individual detection instances.
Note: Viewing detections and adding annotations require the View Detections permission. See Managing Roles for details.
Each detection is enriched automatically with entity context and MITRE ATT&CK technique mappings before it is surfaced to analysts.
To access detections, on the left navigation menu, click Security Operations > Detections.
Understanding Detections

Detections provide two important visualizations:
Detection Trend Chart
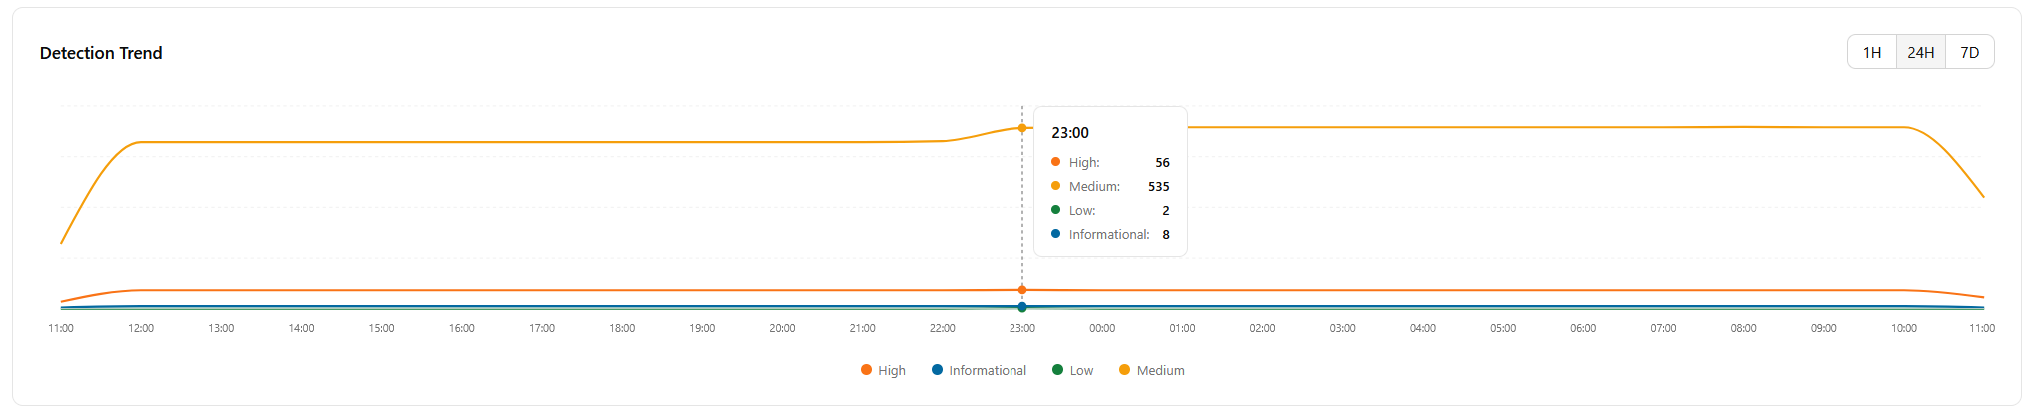
The Detection Trend chart displays detection volume over the selected time range, with a separate line series per severity level: Critical (Red), High (orange), Medium (yellow), Low (green), and Informational (blue). Use the 1H, 24H, and 7D radio buttons in the top-right corner of the chart to change the time range. This time range also applies to the Understanding Detection Rule Matches.
Hover over any point on the chart to see a tooltip showing the per-severity counts at that timestamp.
MITRE Tactics Chart
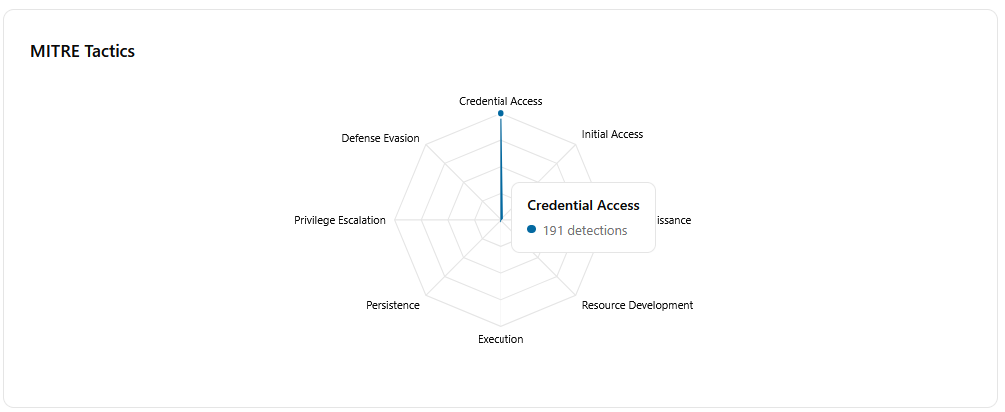
The MITRE Tactics chart uses a radar diagram to show the distribution of active detections across MITRE ATT&CK tactics. Each axis represents one tactic. The example image below represents detections in a polygon area displaying multiple MITRE tactics such as Credential Access, Initial Access, Reconnaissance, Resource Development, and more. This area grows as more detections map to a particular tactic.
Hover over any tactic axis to see a tooltip showing the tactic name and the total detection count for that tactic.
Understanding Detection Rule Matches
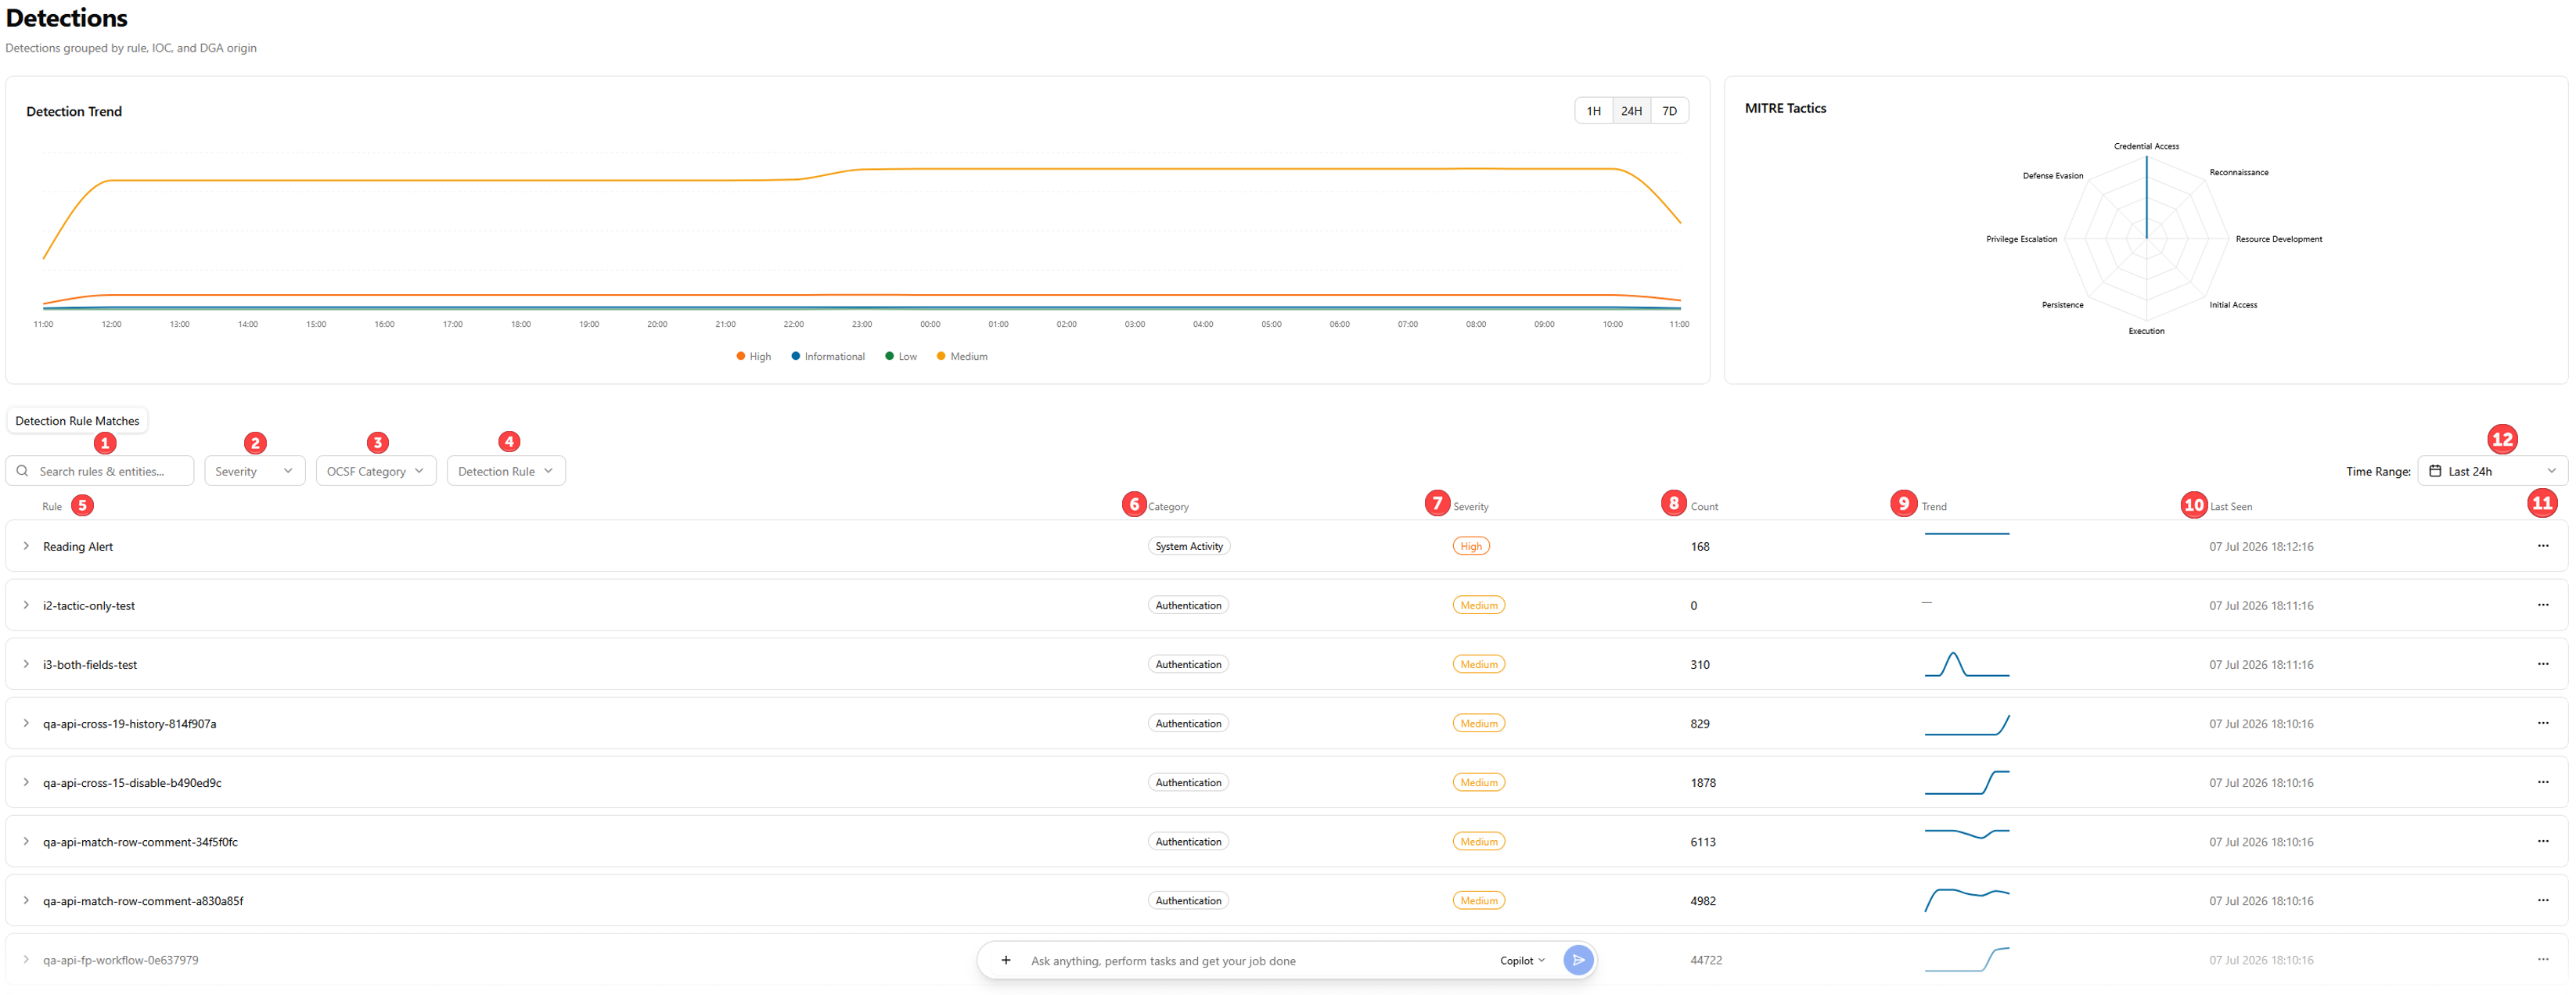
Detection Rule Matches represent detections produced by AQL rules, grouped by rule name. Each group row represents one detection rule and the set of entities that triggered it within the active time range.
 Search rule & entities: free-text search across rule names and entity values
 Severity: multi-select filter by severity level
 OCSF Category: multi-select filter by OCSF category assigned to the rule
 Detection Rule: search by rule name
 Rule: Denotes the detection rule name and the matched entities.
 Category: Signifies the OCSF category assigned to the rule, such as Authentication or Network Activity.
 Severity: Captures the color-coded severity badge for the rule, containing levels such as Critical (Red), High (orange), Medium (yellow), Low (green), and Informational (blue).
 Count: Counts the total number of detection instances in the active time range.
 Trend: Shows detection frequency over the time range using a sparkline trend.
 Last Seen: Denotes the timestamp of the most recent detection instance.
 More Options: Click the ellipsis icon (…) on each row to select one of two options:
-
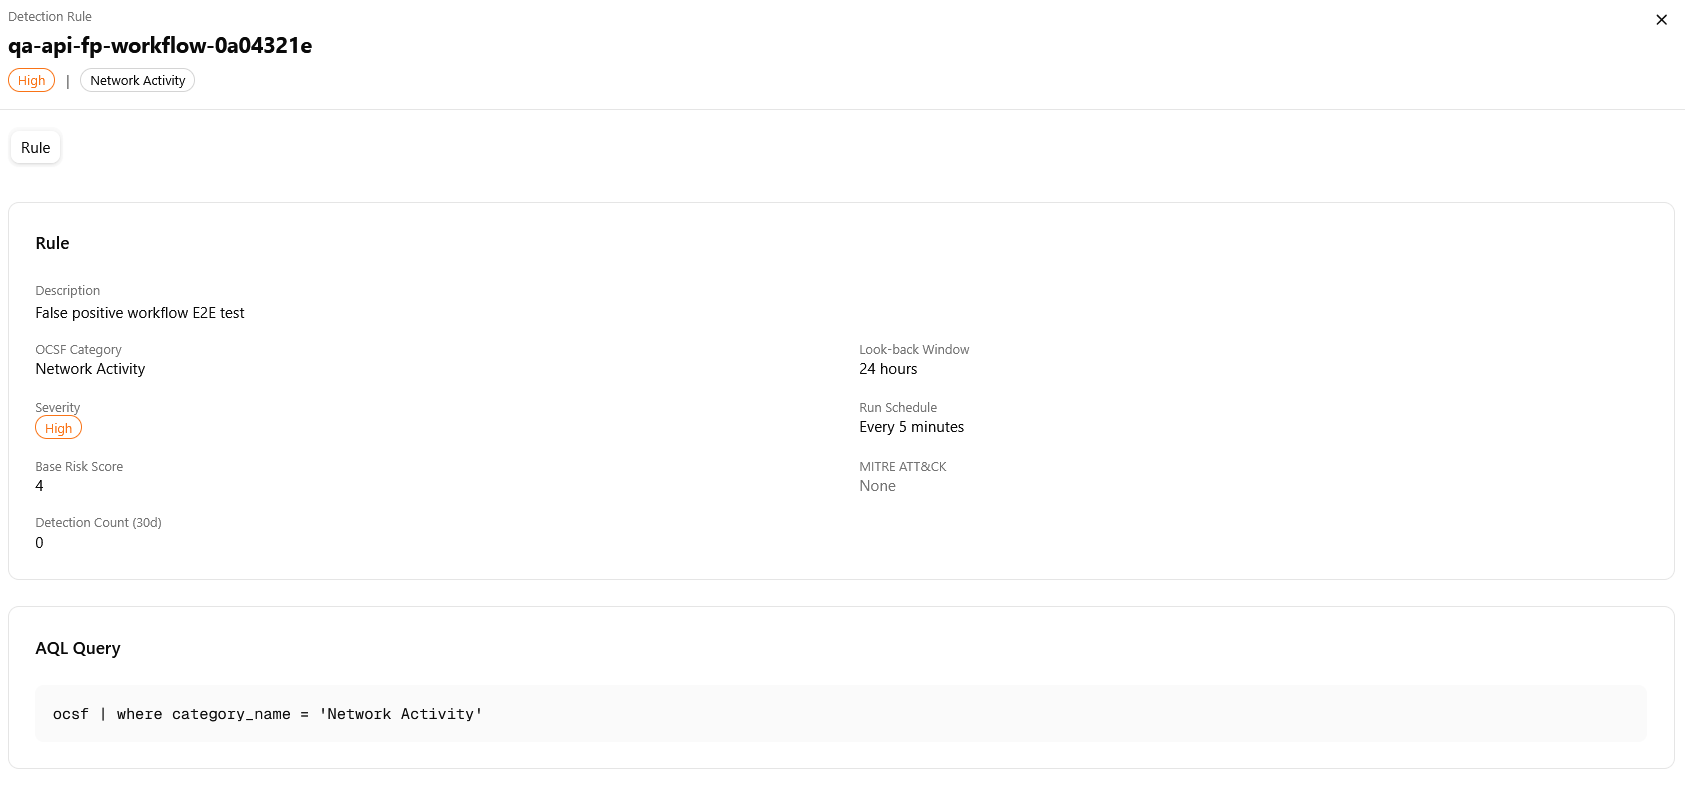
Detail: This option displays the configuration for the detection rule that produced this set of involved entities. The panel displays the rule name, severity, and OCSF category in the header, and a Rule tab with the following fields: Description, OCSF Category, Severity, Base Risk Score, Detection Count (30 days), Look-back Window, Run Schedule, MITRE ATT&CK, and the AQL Query used by the rule.
-
Edit Rule: This option opens the detection rule editor. See Detection Rules for more information.
 Time Range: time range selector on the top-right that sets the active time window for both the charts and the detection list. Options include Last 1h, Last 24h, Last 7d, Last 30d, and Custom.
Viewing Per-Detection Details
Expanding each row reveals the individual entities matched by that rule within the active time range.
See Viewing Matched Detections for more information.