Viewing Attack Surface Management Report Details
On ASM report details pages, you can view details ASM results of previous scans. You can view ASM report details in the ThreatStream interface and in an HTML file.
Viewing ASM Report Details in the ThreatStream Interface
Viewing ASM Report Details in an HTML File
Viewing ASM Report Details in the ThreatStream Interface
An ASM report details page displays total counts of issues discovered during the scan.
To view ASM report details in the ThreatStream interface:
-
Navigate to ThreatStream > Analyze > Attack Surface Management.
-
Click the Reports tab.
-
Click the ASM report that you want to view.
The ASM report that opens includes the details described below.
(Click the image to enlarge it.)
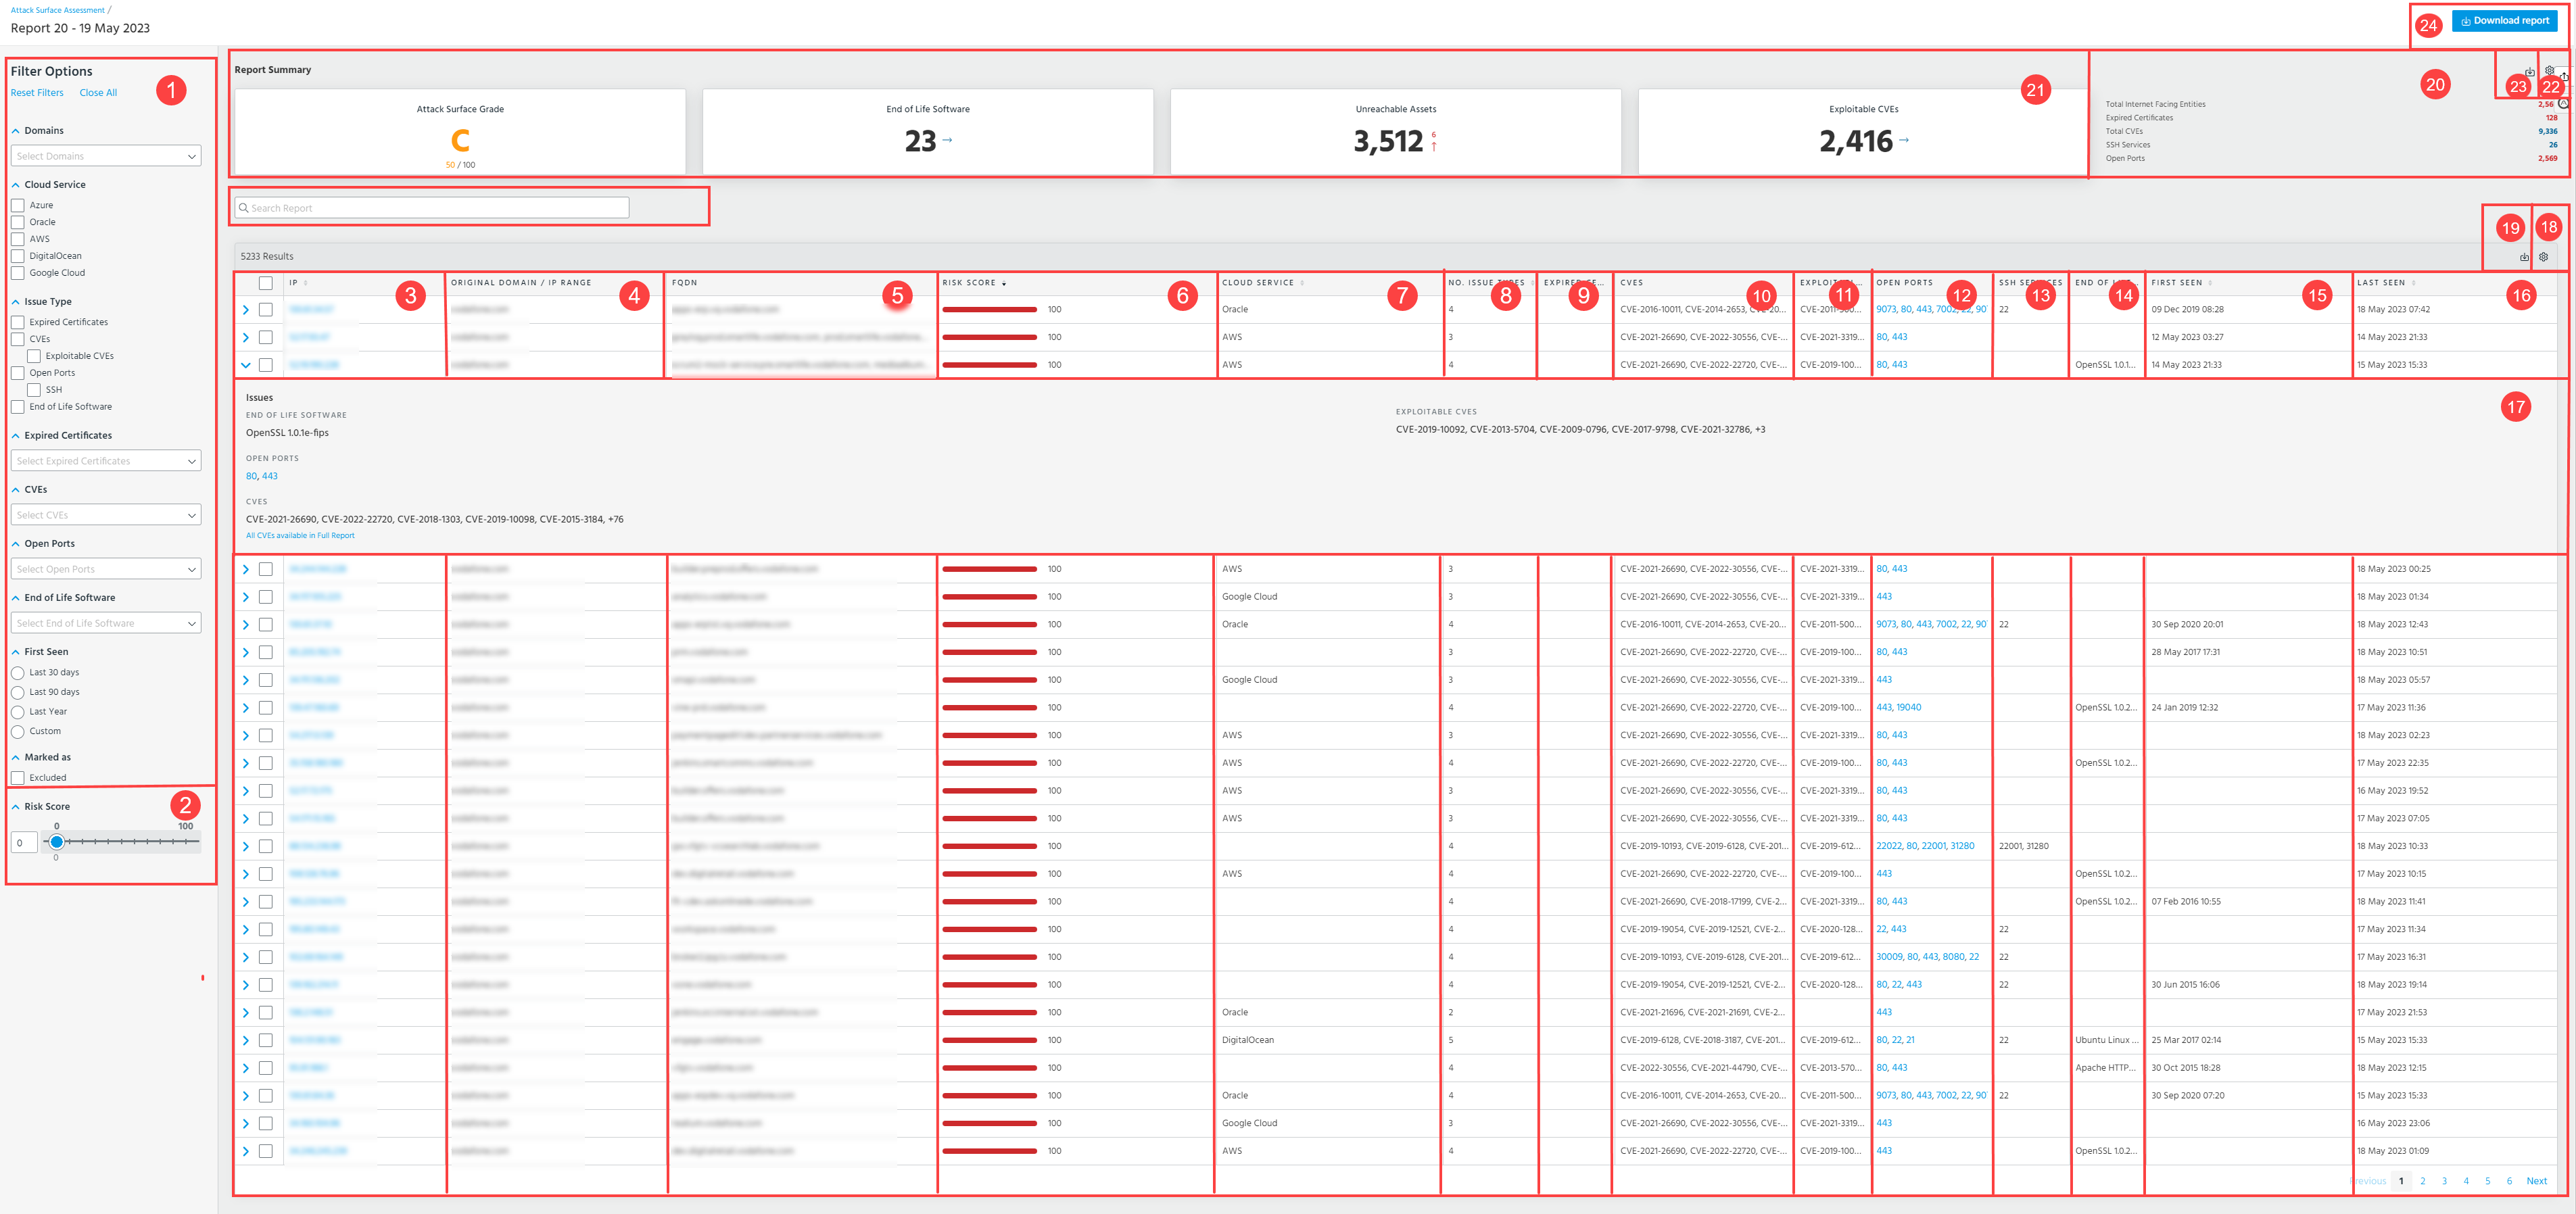
 Filter Options: Filter ASM details by Domains, IPs, IP Ranges, Cloud Service, Issue Type, Expired Certificates, CVEs, Open Ports, End of Life Software, Marked as Excluded, and the time when the IP addresses related to the domains or IP ranges configured for the ASM report were first seen.
 Risk Score: Move the toggle or manually enter a number from 0 to 100 to filter assets by an Asset Risk Score. When a risk score is set, all assets that have a specified risk score or higher are displayed. See Asset Risk Score for details.
 IP: IP addresses of services, hosts, servers, domains, and other types of assets.
 Original Domain/IP Range: Domains names or IP ranges originally entered in the Settings. See Configuring Attack Surface Management Settings for details.
 FQDN: Names of discovered fully qualified domains.
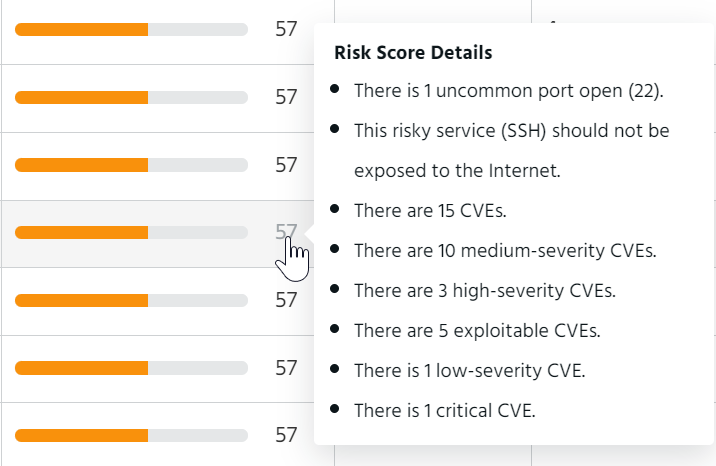
 Risk Score: Asset risk score. Click the risk score of your interest to see details. See Asset Risk Score for details.
Below is the example of the risk score details.
 Cloud Service: Types of cloud services discovered. For example, AWS, Azure, Google Cloud.
 No.Issue Type: Number of issue types discovered.
 Expired Certificates: Discovered expired certificates.
 CVEs: Discovered Common Vulnerabilities and Exposures (CVEs).
 CVEs with Documented Exploits: Discovered CVEs with Documented exploits.
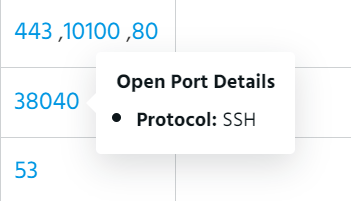
 Open Ports: Discovered open ports. Click the port of your interest to view details.
Below is the example of the open ports details.
 SSH Services: Discovered SSH ports that are open.
 End of Life Software: Instances of End of Life software discovered.
 First seen: Date and time when the IP addresses were first seen by Anomali.
 Last seen: Date and time when the IP addresses were last seen by Anomali.
 Issues: To see issues associated with a particular IP address, click the corresponding arrow.
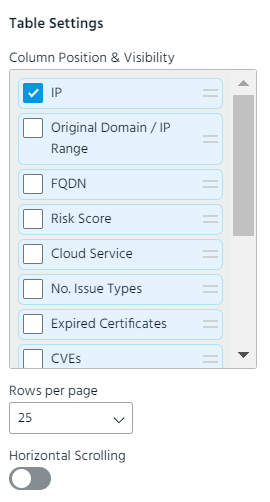
 Table settings: Select the columns you want to be displayed. The following columns are hidden by default: Expired Certificates, CVEs, CVEs with Documented Exploits, Open Ports, SSH Services, and End of Life Software. Additionally, you can change the order of columns in the table by using the drag-and-drop functionality, specify the number of rows to be displayed per page, and enable/disable horizontal scrolling.
 Export to CSV: Export ASM report details to a CSV file. See Exporting ASM Report Details to a CSV File for details.
 Number of issues identified in the latest report for the metrics that are not displayed as widgets. Red numbers indicate the upward trend, green numbers indicate the downward trend, and blue numbers indicate the stable trend of the reported issues.
 Widgets displaying trends of metrics over the period of time selected in the Filter Options. Red arrows indicate the upward trend, green arrows indicate the downward trend, and blue arrows indicate the stable trend of the metrics.
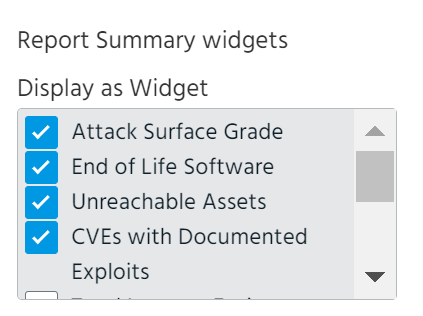
 Settings: Select the metrics you want to be displayed as widgets. The following Report Summary widgets are available for selection:
-
Attack Surface Grade: Displays an overall attack surface grade for the organization and metric trend over the period of time selected in the Filter Options. The widget is displayed by default. See Attack Surface Grade for details.
Note: If data is insufficient for generating a grade, the Attack Surface Grade widget displays a dash (-).
-
End of Life Software: Displays the End of Life Software metric trend over the period of time selected in the Filter Options. The widget is displayed by default.
-
Unreachable Assets: Displays the Unreachable Assets metric trend over the period of time selected in the Filter Options. The widget is displayed by default.
-
CVEs with Documented Exploits: Displays the CVEs with Documented Exploits metric trend over the period of time selected in the Filter Options. The widget is displayed by default.
-
Total Internet Facing Entities: Displays the Internet Facing Entities metric trend over the period of time selected in the Filter Options.
-
Expired Certificates: Displays the Expired Certificates metric trend over the period of time selected in the Filter Options.
-
Total CVEs: Displays the CVEs metric trend over the period of time selected in the Filter Options.
-
SSH Services: Displays the SSH Services metric trend over the period of time selected in the Filter Options.
-
Open Ports: Displays the Open Ports metric trend over the period of time selected in the Filter Options.
 Export PDF: Export widgets to a PDF file. See Exporting Widgets to a PDF File for details.
 Download report: Download the ASM report in the HTML file format.
 Search Report: Search for an asset by entering its IP address or other details related to it. The search is performed withing all table columns.
Viewing ASM Report Details in an HTML File
From an ASM report details page, you can also download an ASM report in the HTML file format to view unique counts of discovered issues and to drill down every issue. Duplicates are removed when the same issue is present in multiple assets.
To view ASM report details in an HTML file:
-
Navigate to ThreatStream > Analyze > Attack Surface Management.
-
Click the Reports tab.
-
Click the ASM report of your interest.
-
Click Download report in the top right corner of the page. The downloading process start immediately.
Alternatively, you can download selected reports from the Reports tab. See Accessing Attack Surface Management History for details.
-
Open the downloaded file to view the details of the ASM report.
Below is the example of the downloaded HTML ASM report. You can view the list of discovered issues within the selected category by clicking the View Details link.
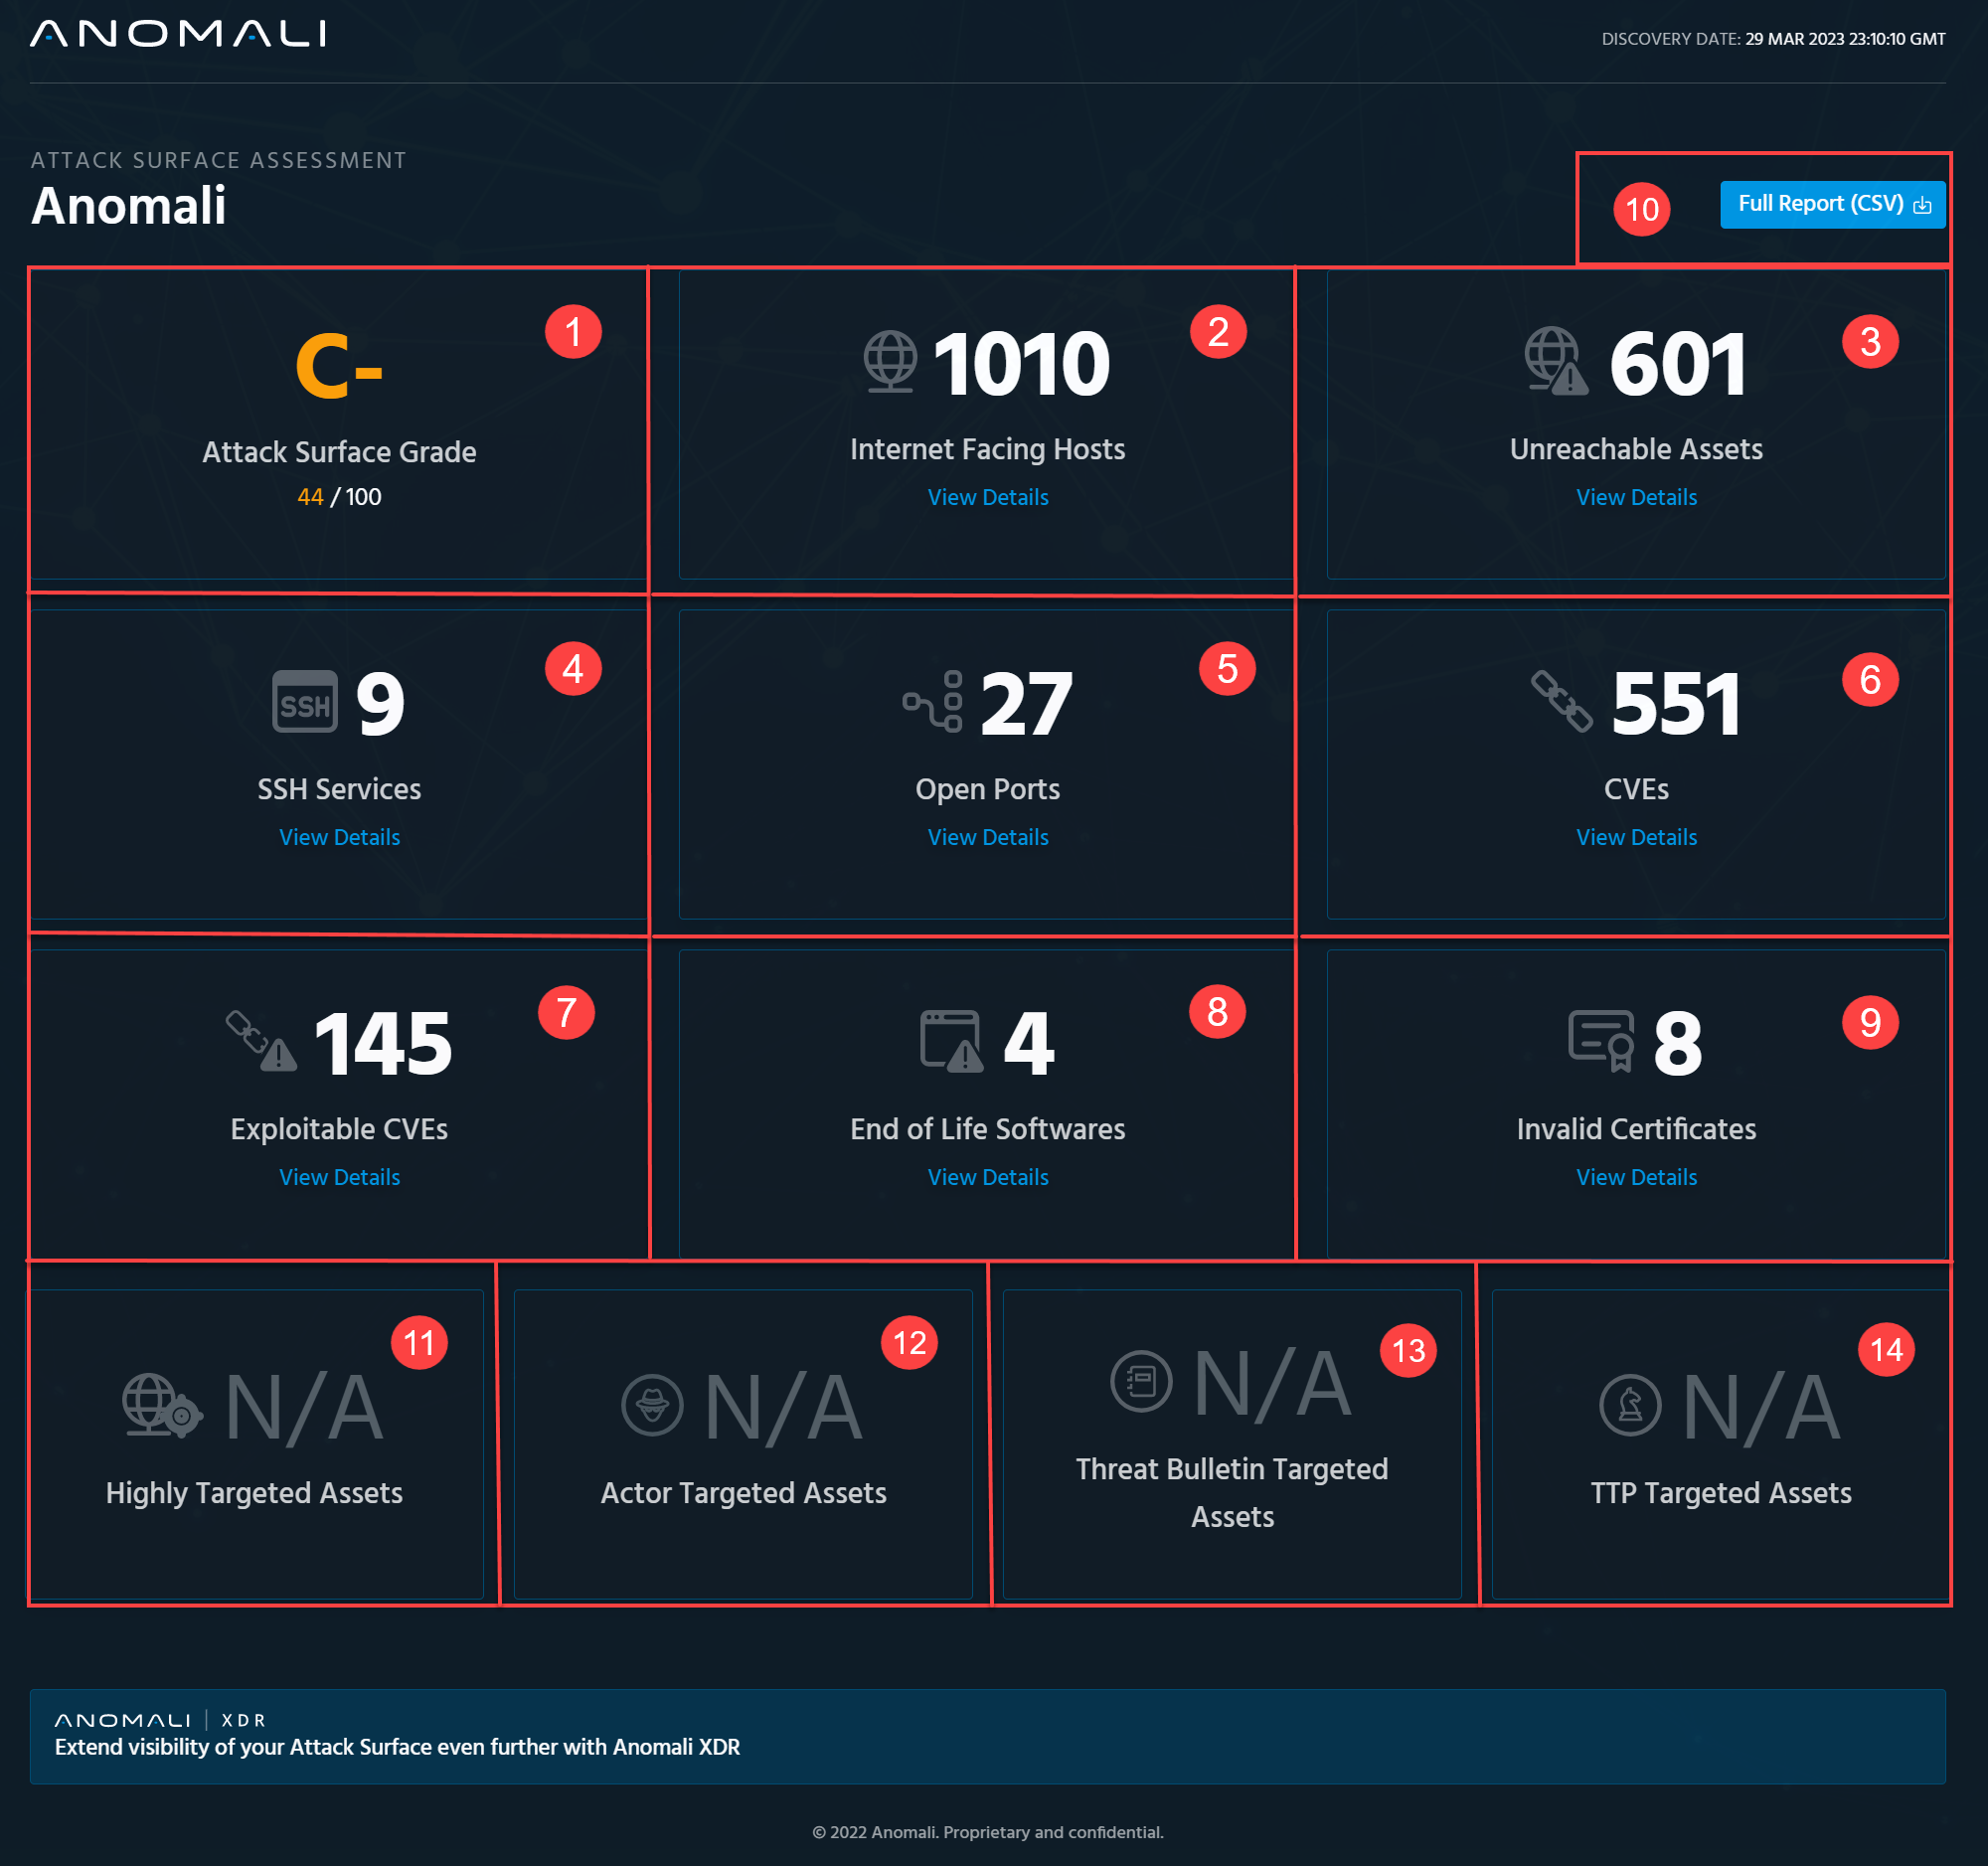 Attack Surface Grade: An overall attack surface grade for the organization. See Attack Surface Grade for details.Note: If data is insufficient for generating a grade, the Attack Surface Grade widget displays a dash (-). Internet Facing Hosts: Number of Internet facing hosts discovered. Unreachable Assets: Number of unreachable assets discovered. SSH services: Number of SSH services discovered. Open Ports: Number of open ports discovered. CVEs: Number of detected common vulnerabilities and exposures that are listed in order of criticality on the category details page. Exploitable CVEs: Number of exploitable vulnerabilities and publicly available exploits. End of Life Software: Number of software that reached end of life. Invalid Certificates: Number of invalid certificates that require updating. Full Report (CSV): Click Full Report (CSV) to download a full version of the ASM report in the CSV file format. Highly Targeted Assets: (Available with Anomali Match Cloud subscription) Number of assets that are being highly targeted in your environment. This information is obtained using the telemetry information available through Anomali Match Cloud. This item in the report gives you an "inside-out" view of your exposed attack surface. Actors Targeted Assets: (Available with Anomali Match Cloud subscription) Number of actors that are or have been active in your environment and their targets. This information is obtained using the telemetry information available through Anomali Match Cloud. This item in the report gives you an "inside-out" view of your exposed attack surface. Threat Bulletins Targeted Assets: (Available with Anomali Match Cloud subscription) Number of threat bulletins with relevant matches to your assets and industry. This information is obtained using the telemetry information available through Anomali Match Cloud. This item in the report gives you an "inside-out" view of your exposed attack surface. TTP Targeted Assets: (Available with Anomali Match Cloud subscription) Number of Tactics, Techniques, and Procedures that are currently being used in your environment. This information is obtained using the telemetry information available through Anomali Match Cloud. This item in the report gives you an "inside-out" view of your exposed attack surface.
To learn what steps to take after viewing ASM report details, see Using ASM ResultsUsing ASM Results
Using ASM Results
After viewing ASM data for your organization, consider taking the following steps:
-
Verify that all Internet facing hosts are active and belong to your organization.
-
Review unreachable assets such as domains or IP addresses that often belong to old DNS records and exposed to public networks. If private IP addresses detected, consider recording them on a private DNS.
-
Verify that all critical services such as DNS, RDP, Telnet, MySQL and others are segregated from high risk systems, patched, and have security controls in place.
-
Use standard ports for SSH services and consider renaming their hosts if a service name (SSH/FTP/SFTP) is used in the host names. This way, they will not be easily discovered by attackers.
-
Verify that discovered open ports do not provide access to critical systems and data.
-
Update or deprecate software that reached end of life.
-
Update invalid certificates.