Viewing Asset Inventory
The Asset Inventory tab on the Attack Surface Management page displays the latest information about the state of your organization assets. The asset inventory table displays data from the most recent scan in which assets were discovered. On the Asset Inventory tab, you can also see the newly discovered assets included to your asset inventory during the last scan, add tags to assets, view and export widgets, and export the latest report details to a CSV file.
To access the Asset Inventory tab, navigate to Analyze > Attack Surface Management.
Below is the example of the Asset Inventory page.
(Click the image to enlarge it.)
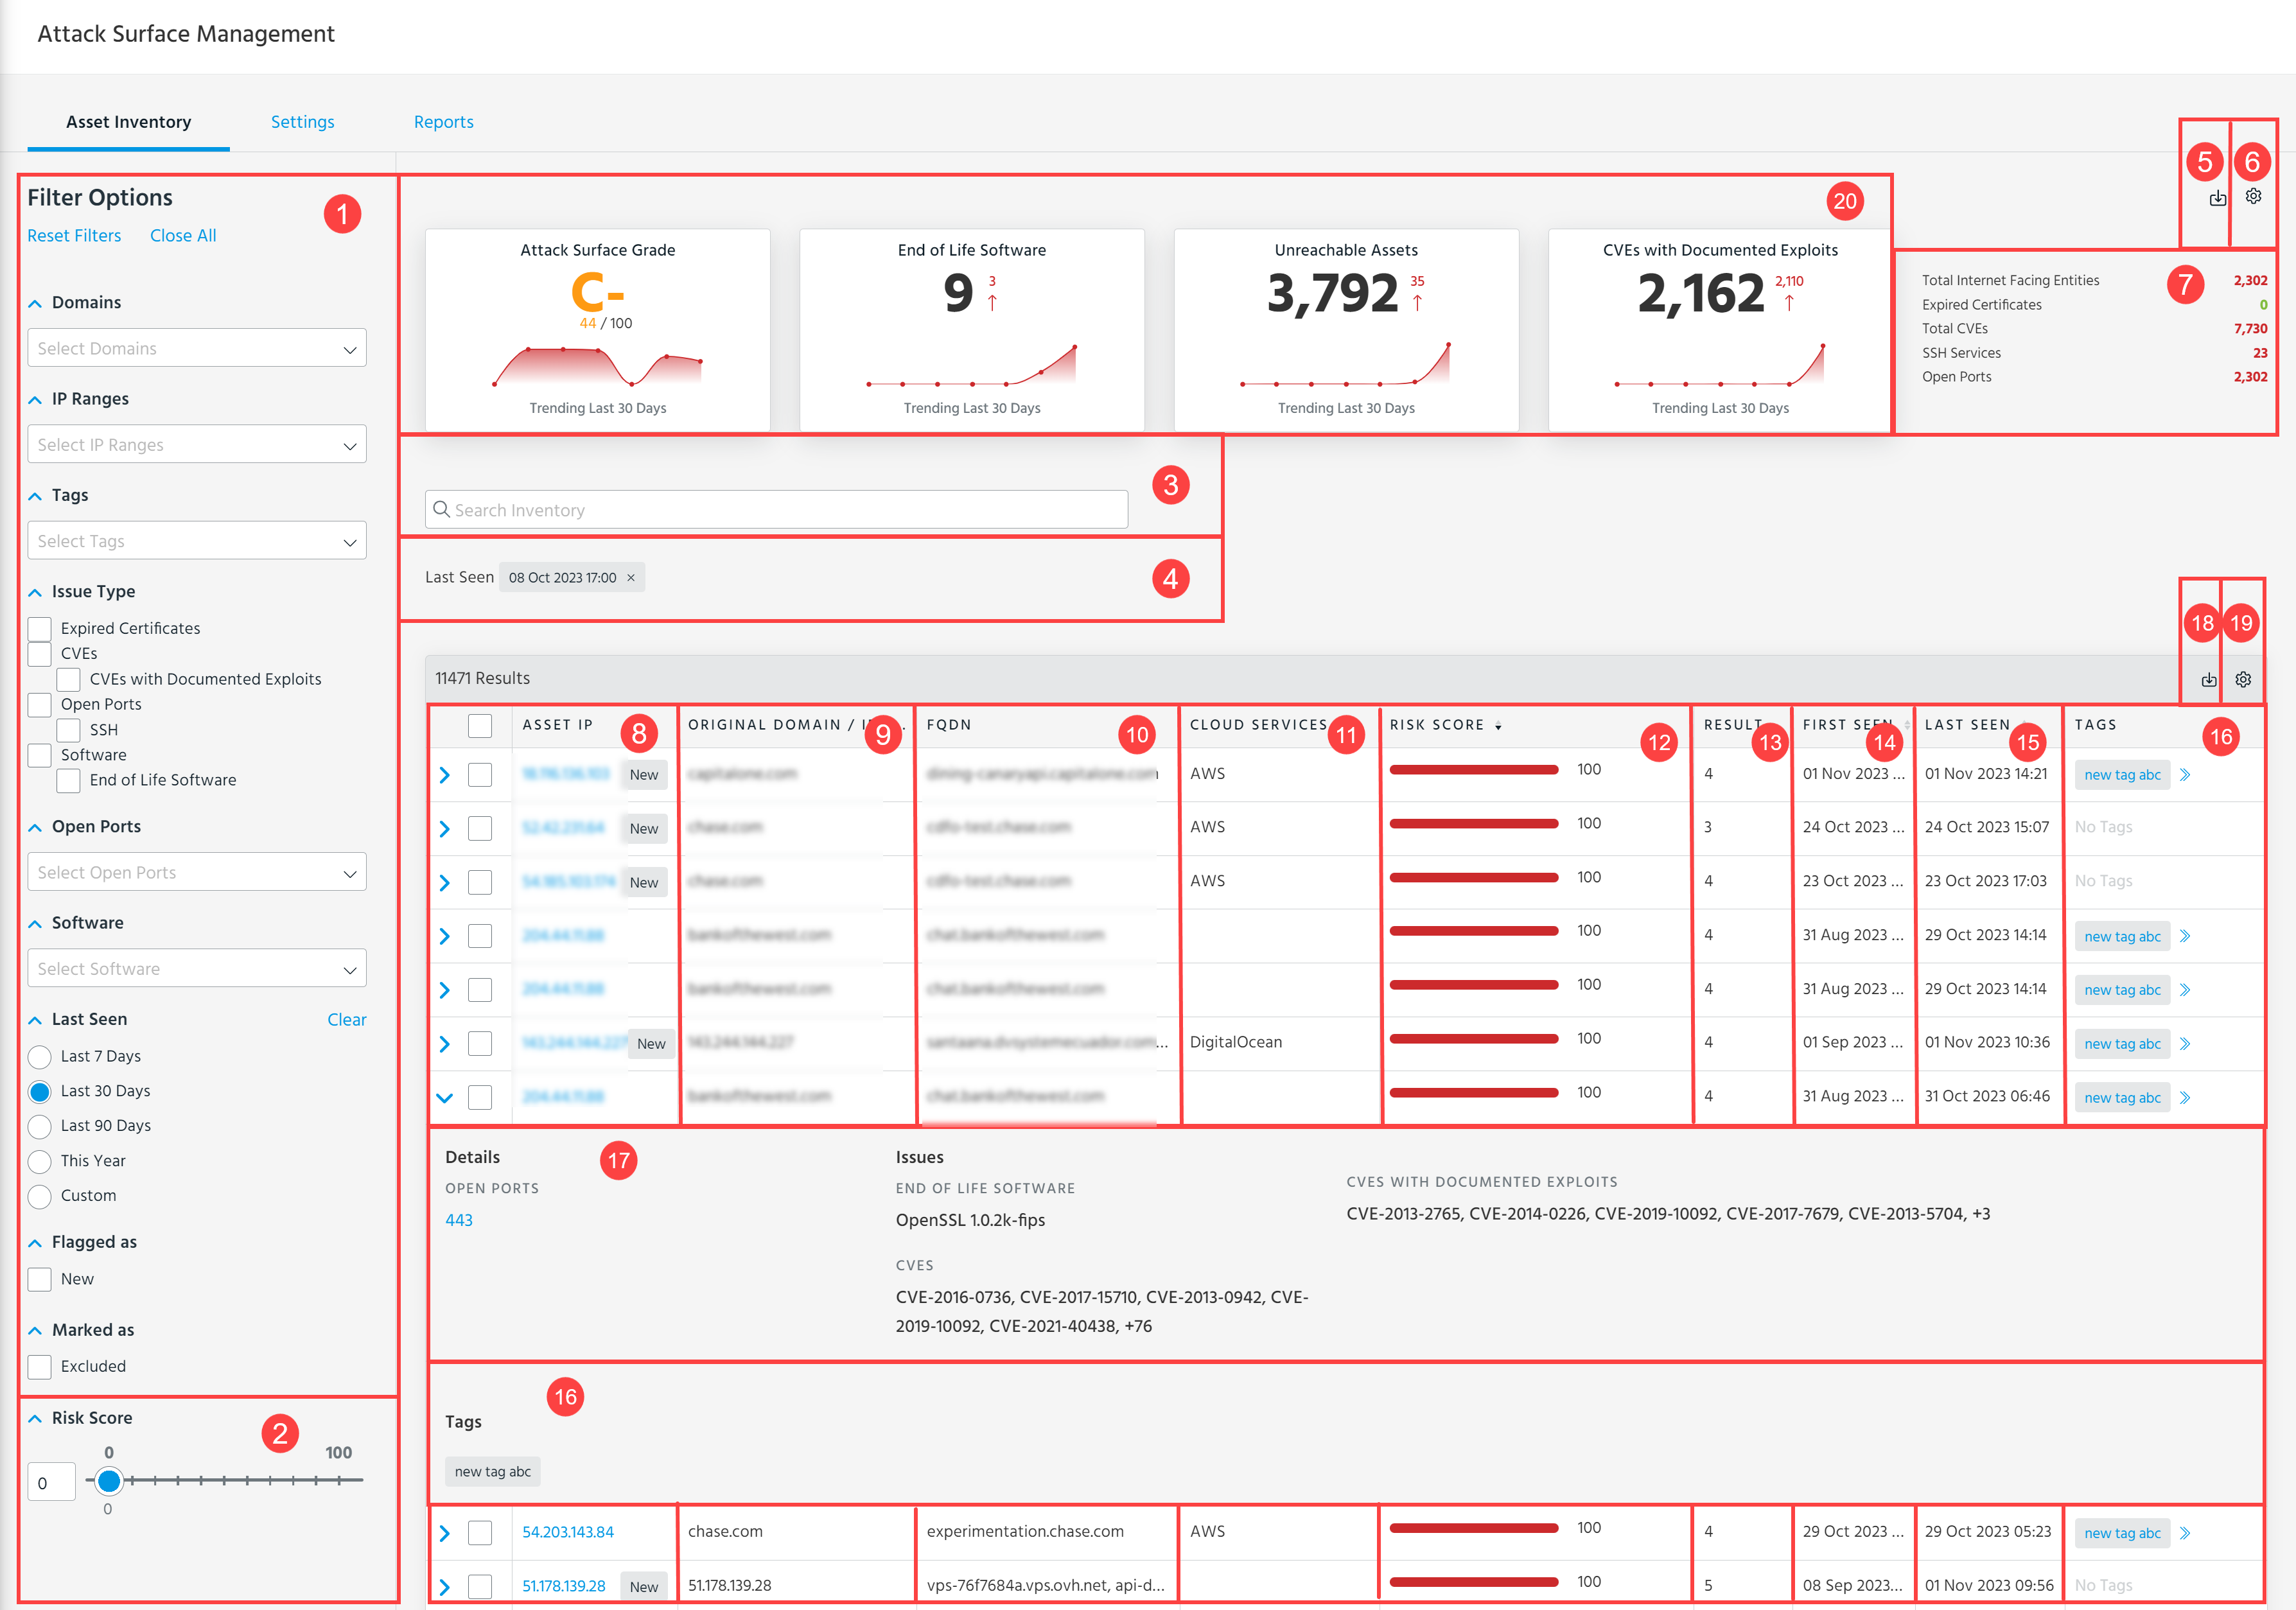
 Filter Options: Filter ASM details by Domains, IP Ranges, Tags, Issue Type, Expired Certificates, CVEs, Open Ports, Software, End of Life Software, last Seen, Flagged as New, and Marked as Excluded.
 Risk Score: Move the toggle or manually enter a number from 0 to 100 to filter assets by an Asset Risk Score. When a risk score is set, all assets that have a specified risk score or higher are displayed. See Asset Risk Score for details.
 Search Inventory: Search for assets by their IPs or details related to them.
 Applied filters.
 Export PDF: Export trending widgets to a PDF file. See Exporting Widgets to a PDF File for details.
 Settings: Select the metrics you want to be displayed as widgets. The following widgets are available for selection:
-
Attack Surface Grade: Displays an overall attack surface grade for the organization and metric trend over the period of time selected in the Filter Options. The widget is displayed by default. See Attack Surface Grade for details.
Note: If data is insufficient for generating a grade, the Attack Surface Grade widget displays a dash (-).
-
End of Life Software: Displays the End of Life Software metric trend over the period of time selected in the Filter Options. The widget is displayed by default.
-
Unreachable Assets: Displays the Unreachable Assets metric trend over the period of time selected in the Filter Options. The widget is displayed by default.
-
CVEs with Documented Exploits: Displays the CVEs with Documented Exploits trend over the period of time selected in the Filter Options. The widget is displayed by default.
-
Total Internet Facing Entities: Displays the Internet Facing Entities metric trend over the period of time selected in the Filter Options.
-
Expired Certificates: Displays the Expired Certificates metric trend over the period of time selected in the Filter Options.
-
Total CVEs: Displays the CVEs metric trend over the period of time selected in the Filter Options.
-
SSH Services: Displays the SSH Services metric trend over the period of time selected in the Filter Options.
-
Open Ports: Displays the Open Ports metric trend over the period of time selected in the Filter Options.
 Number of issues identified in the latest report for the metrics that are not displayed as widgets. Red numbers indicate the upward trend, green numbers indicate the downward trend, and blue numbers indicate the stable trend of the reported issues.
 Asset IP: IPs of assets.
 Original Domain/IP Range: The domain or IP range to which the asset is linked.
 FQDN: Names of fully qualified domains.
 Cloud Services:Type of cloud services associated with IPs discovered. For example, AWS, Azure, Google Cloud.
 Risk Score: Asset risk score. Click the risk score of your interest to see details. See Asset Risk Score for details.
 Result Type Count: Result type count.
 First Seen: Date and time when the IP addresses were first seen by Anomali.
 Last seen: Date and time when the IP addresses were last seen by Anomali.
 Tags: Tags associated with the assets.
 Issues: Click the corresponding arrow to see issues associated with a particular IP address.
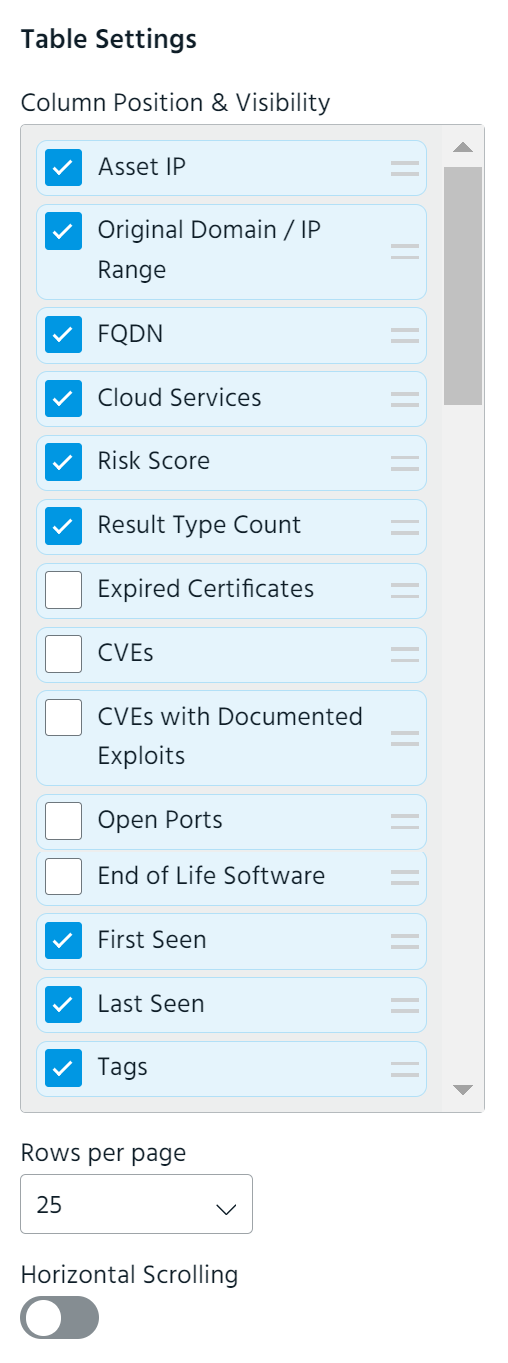
 Table Settings: Select the columns you want to be displayed. The following columns are hidden by default: Expired Certificates, CVEs, CVEs with Documented Exploits, Open Ports, SSH Services, Software, and End of Life Software. Additionally, you can change the order of columns in the table by using the drag-and-drop functionality, specify the number of rows to be displayed per page, and enable/disable horizontal scrolling.
 Export to CSV: Export results of the latest asset scan to a CSV file. See Exporting ASM Details to a CSV File from the Assset Inventory Tab for details.
 Widgets displaying trends of metrics over the period of time selected in the Filter Options. Red arrows indicate the upward trend, green arrows indicate the downward trend, and blue arrows indicate the stable trend of the metrics.
On the Asset Inventory tab, you can also apply the following actions to selected assets:
-
Export asset details to a CSV file. See Exporting Attack Surface Management Data for details.
-
Add existing tags to assets. See Adding and Removing Asset Tags for details.
-
Remove existing tags from assets. See Adding and Removing Asset Tags for details.