Working with Visualizations
Visualizations help you gain data insights across different security use cases by providing an interactive visual snapshot of your data. Use the Visualization tab to view the associated visualization and configure its properties.
All visualization types support both the eventlog and OCSF Version 1.2 schema fields with dotted notation. See OCSF Schema Overview for more information on the OCSF fields and naming conventions.
When Schema RBAC is active for your organization, the schema filters in your assigned roles determine which data this feature returns. An eventlog filter limits your results to only the eventlog data your role permits, and an OCSF filter limits your results to only the OCSF data your role permits. If a query runs against a schema for which your role has no filter assigned, the query returns a forbidden error. For details, see Role-Based Access Control for Schemas.
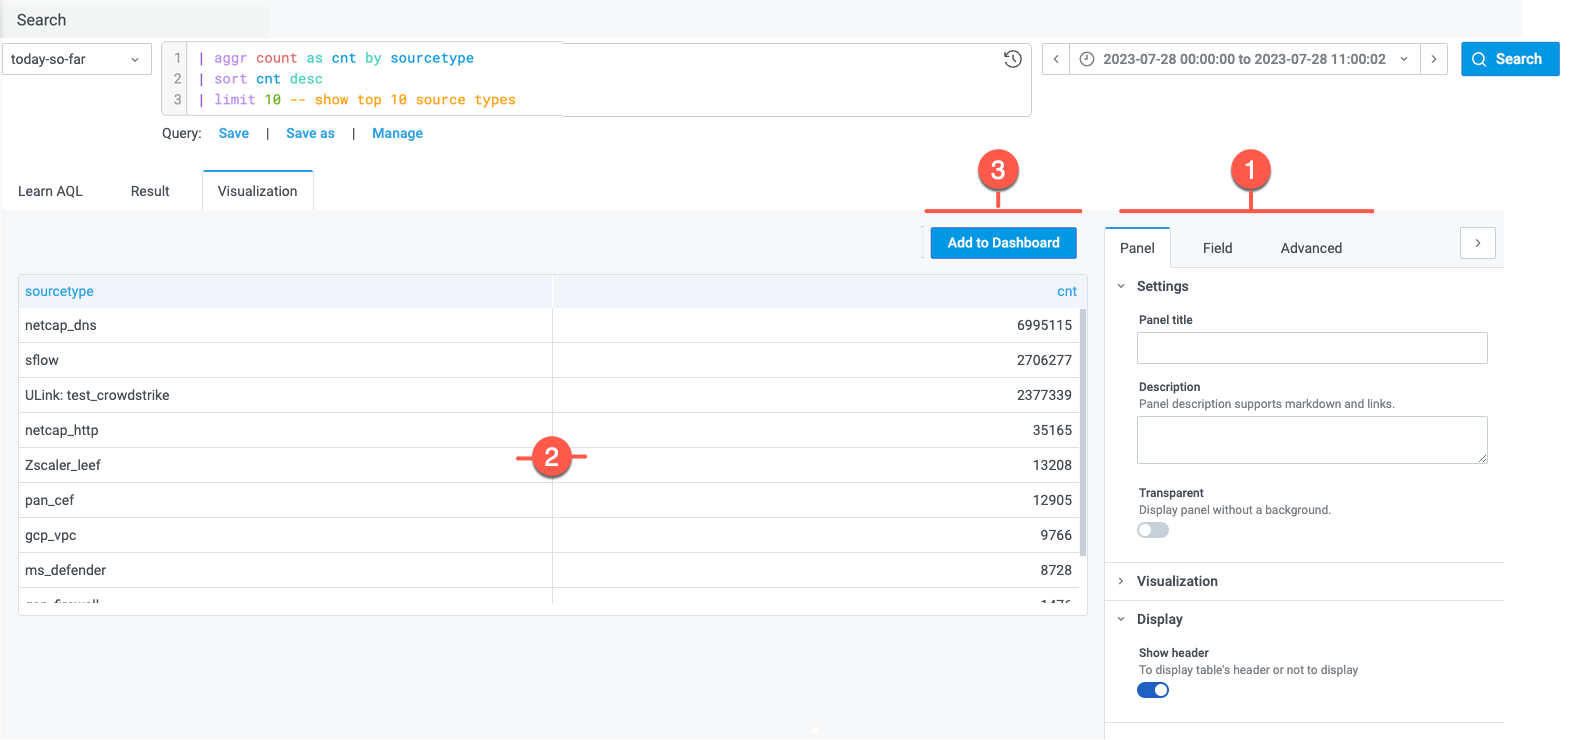
(Click the image to enlarge it.)

|
Configure visualization settings:
|

|
Preview Canvas: The preview area for the visualization. The preview reflects your refined query and applied panel settings. |

|
Add to Dashboard: After you have customized the visualization as desired, click Add to Dashboard and configure the settings to add the visualization as a panel in a new or existing dashboard. |
Panel Settings
Use the Panel tab to specify a panel title and to select a visualization type and data fields, among other options.
| Setting | Description |
|---|---|
| Panel title | Titles appear at the top of a panel. |
| Description | Descriptions appear as tooltips. Markdown and links are supported. |
| Transparent | Display panel without a background. |
| Visualization |
Select a visualization type to display your data. See About AQL Visualization Types for descriptions of available visualization types. All visualization types support OCSF Version 1.2 fields with dotted notation. See OCSF Schema Overview for more information. |
| Display options | Groups of display options vary by visualization type. |
Field Settings
Use the Field tab to define options for rendering data fields in the visualization.
| Setting | Description |
|---|---|
| Visualization options | Groups of field settings vary by visualization type. |
| Standard options |
|
| Thresholds | If the color scheme is set to From thresholds (by value), specify the colors based on count or percentage thresholds for data fields. |
| Value mappings | Map a single value or range of values to a specified text string. |
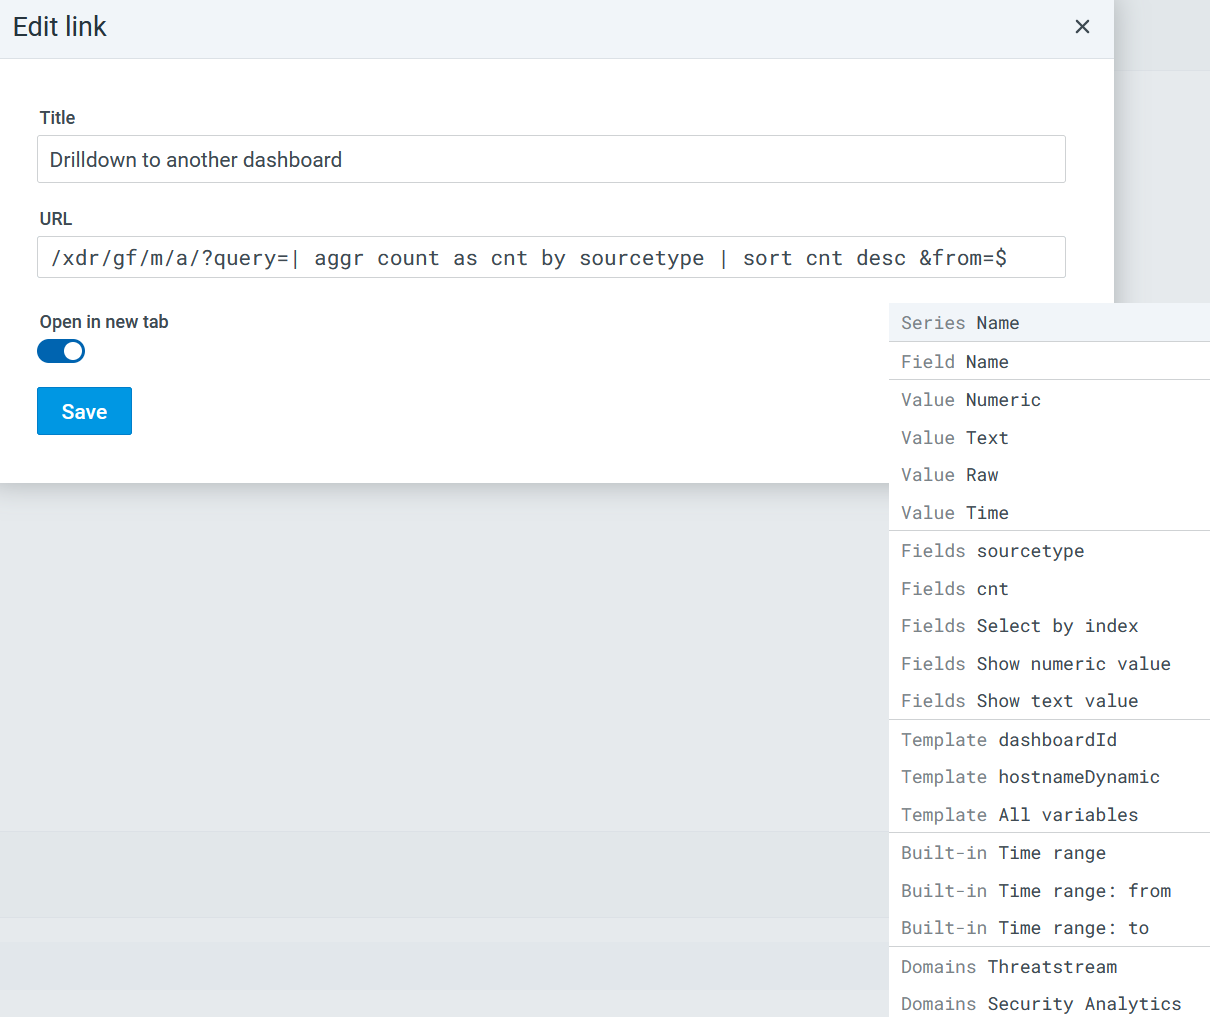
| Data links |
Click +Add link and complete settings for link behavior when a user clicks data fields in the visualization. You can use the following URL types and configure them to pass variables:
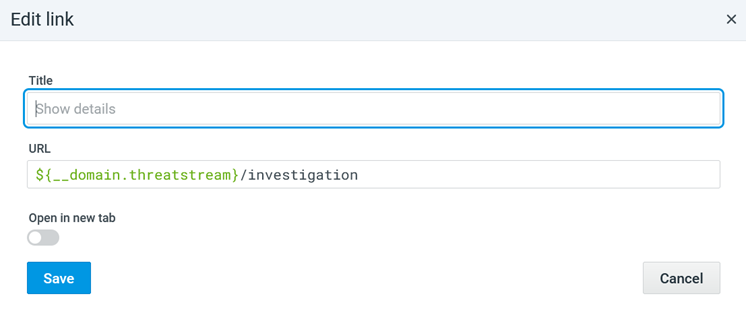
You can use a relative URL in either of the following ways:
To use a URL in ThreatStream or Security Analytics domains, do the following:
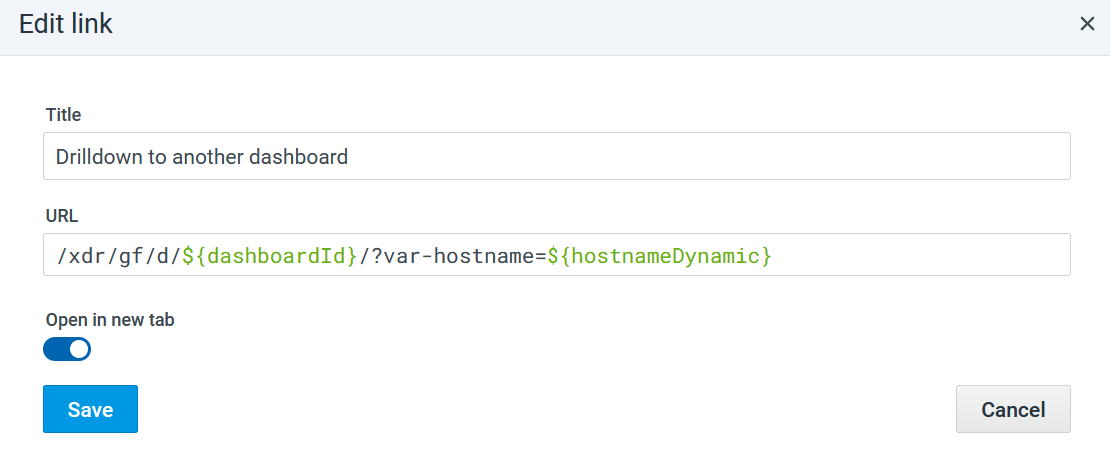
Add link to another dashboard To use the data in a dashboard panel as context for navigating to a different dashboard and populating its panels in ThreatStream or Security Analytics:
When done correctly, the data link would have the following formats: Single variable: Single context variable with its value. Copy
Multiple variables: Multiple context variables and their corresponding values, separated by ampersand ( Copy
In the example in the screenshot above, clicking on a linked dashboard panel will carry the context through Alternatively, instead of entering the value in Step 4, you can also type a dollar-sign ( Copy
|
 ) on the top-left.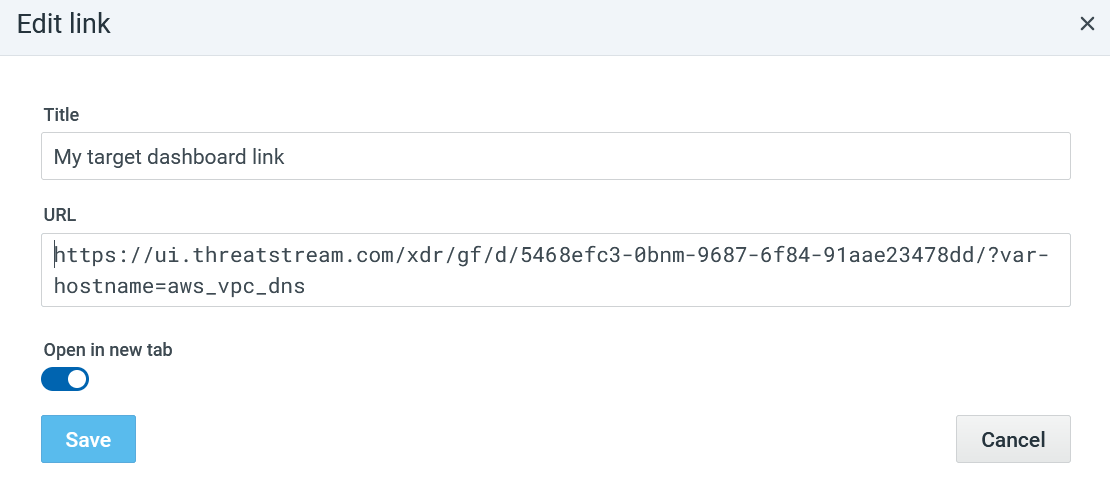
Advanced Settings
Use the Advanced tab to define options for specific fields that are different from the settings defined on the Fields tab.