About the Text Visualization Type
Use the Text visualization type to add a dashboard panel that accepts Markdown-formatted input text.
(Click the image to enlarge it.)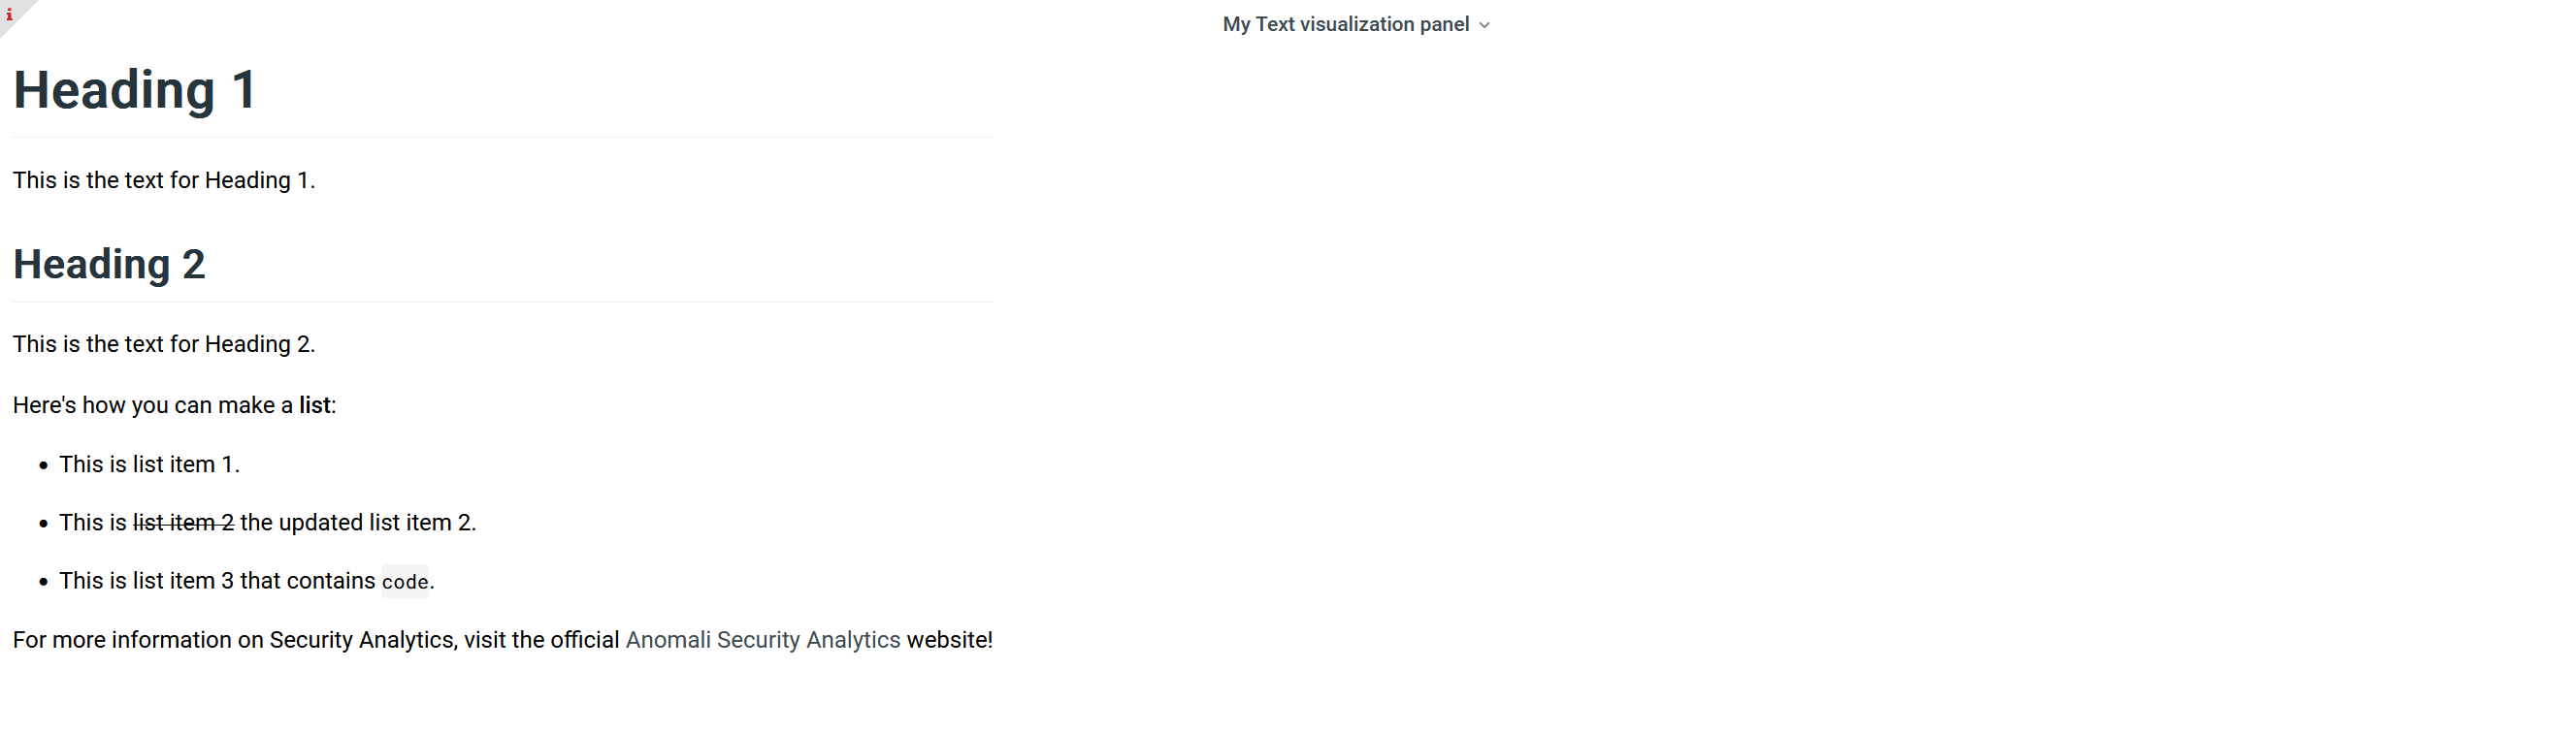
Use case
You can use the Text visualization to:
-
Add instructions, descriptions, or reports about using different panels in the dashboard, leading to detailed and well-documented dashboards.
-
Capture important contextual information or warning messages you must know to accurately use the dashboard, its workflows, or drilldown capabilities, to name a few.
-
Share confidential banners that carry critical information intended for only certain groups of users, helping in dashboard user management.
-
Embed images, code snippets, and hyperlinks to create highly informative dashboards that can support documentation and training purposes.
Panel Options
Use the options in the Panel tab to customize the options described in the following table.
| Setting | Description | |
|---|---|---|
| Settings | Panel title | Titles appear at the top of a panel. |
| Description | Descriptions appear as tooltips. Markdown and links are supported. | |
| Transparent | Display panel without a background. |
Field Options
Use the options in the Fields tab to customize the options described in the following table.
| Setting | Description | |
|---|---|---|
| Data links | Add link |
Click +Add link and complete settings for link behavior when a user clicks data fields in the visualization. You can use the following URL types and configure them to pass variables:
You can use a relative URL in either of the following ways:
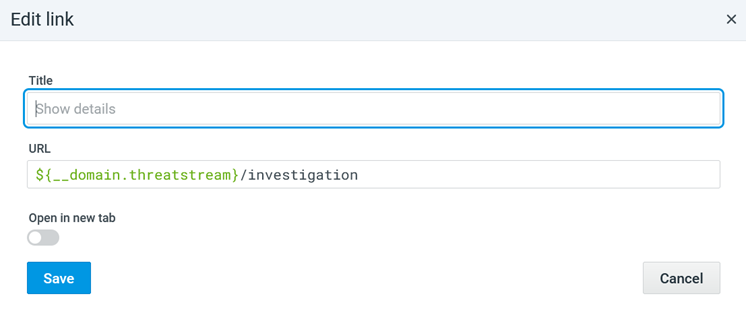
To use a URL in ThreatStream or Security Analytics domains, do the following:
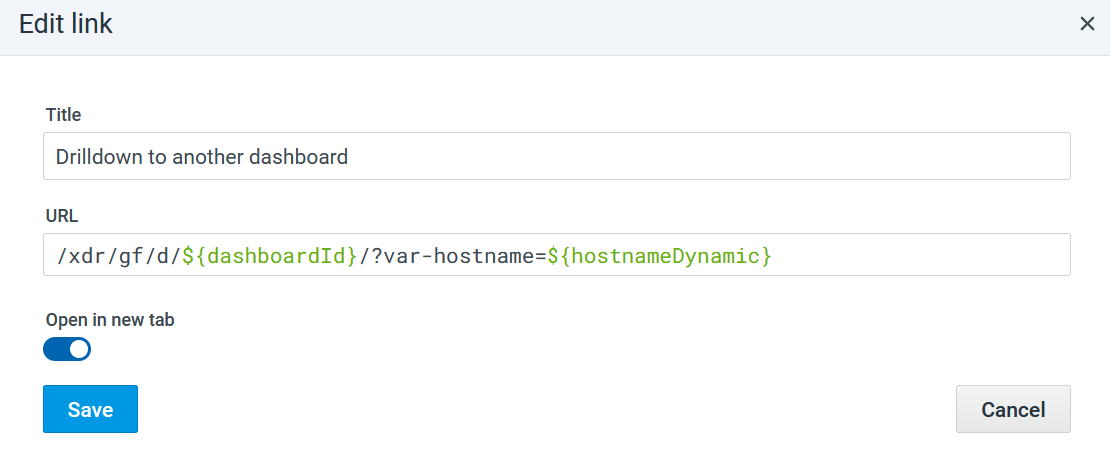
Add link to another dashboard To use the data in a dashboard panel as context for navigating to a different dashboard and populating its panels in ThreatStream or Security Analytics:
When done correctly, the data link would have the following formats: Single variable: Single context variable with its value. Copy
Multiple variables: Multiple context variables and their corresponding values, separated by ampersand ( Copy
In the example in the screenshot above, clicking on a linked dashboard panel will carry the context through Alternatively, instead of entering the value in Step 4, you can also type a dollar-sign ( Copy
|
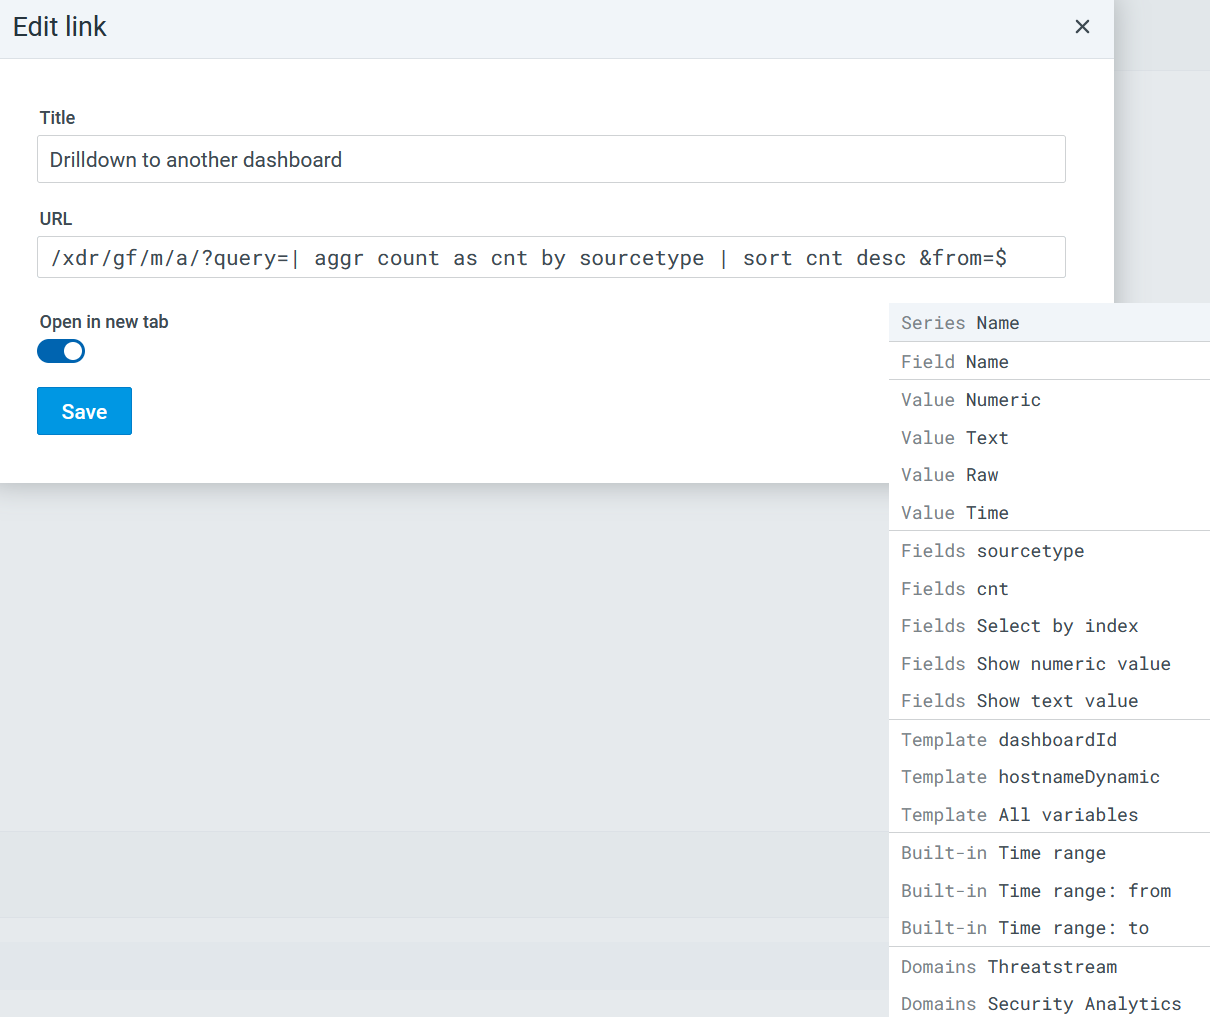
 ) on the top-left.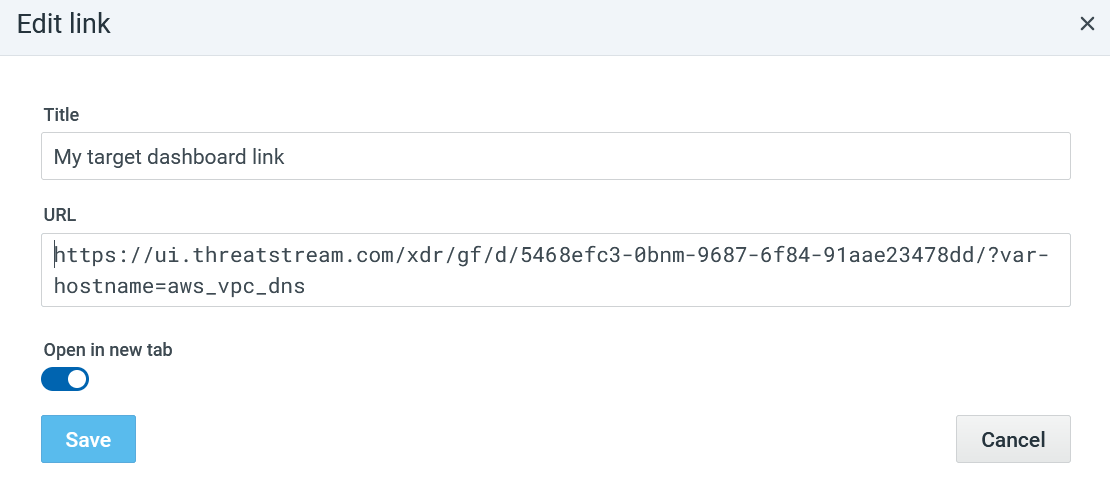
Advanced Options
Use the options in the Advanced tab to override the settings configured in the Fields tab for particular fields. For example, you can override the automatic color palette selected for a particular field to a preferred single color.
You have the following options to select field settings to be overridden:
-
Fields with name: Set properties for a specific field.
-
Fields with name matching regex: Set properties for fields with names matching a regex.
-
Fields with type: Set properties for fields with a specific type (numeric, string, Boolean).
-
Fields returned by query: Set properties for fields from a specific query.
Once you add this visualization type to your dashboard, you can also manage your dashboard panels.
See Manage dashboard panels to learn more about how you can edit panel settings to modify the visualization and apply advanced transformations, share panels with permitted users in your organization, or even view the panel JSON model, and so on.
Support for Variables
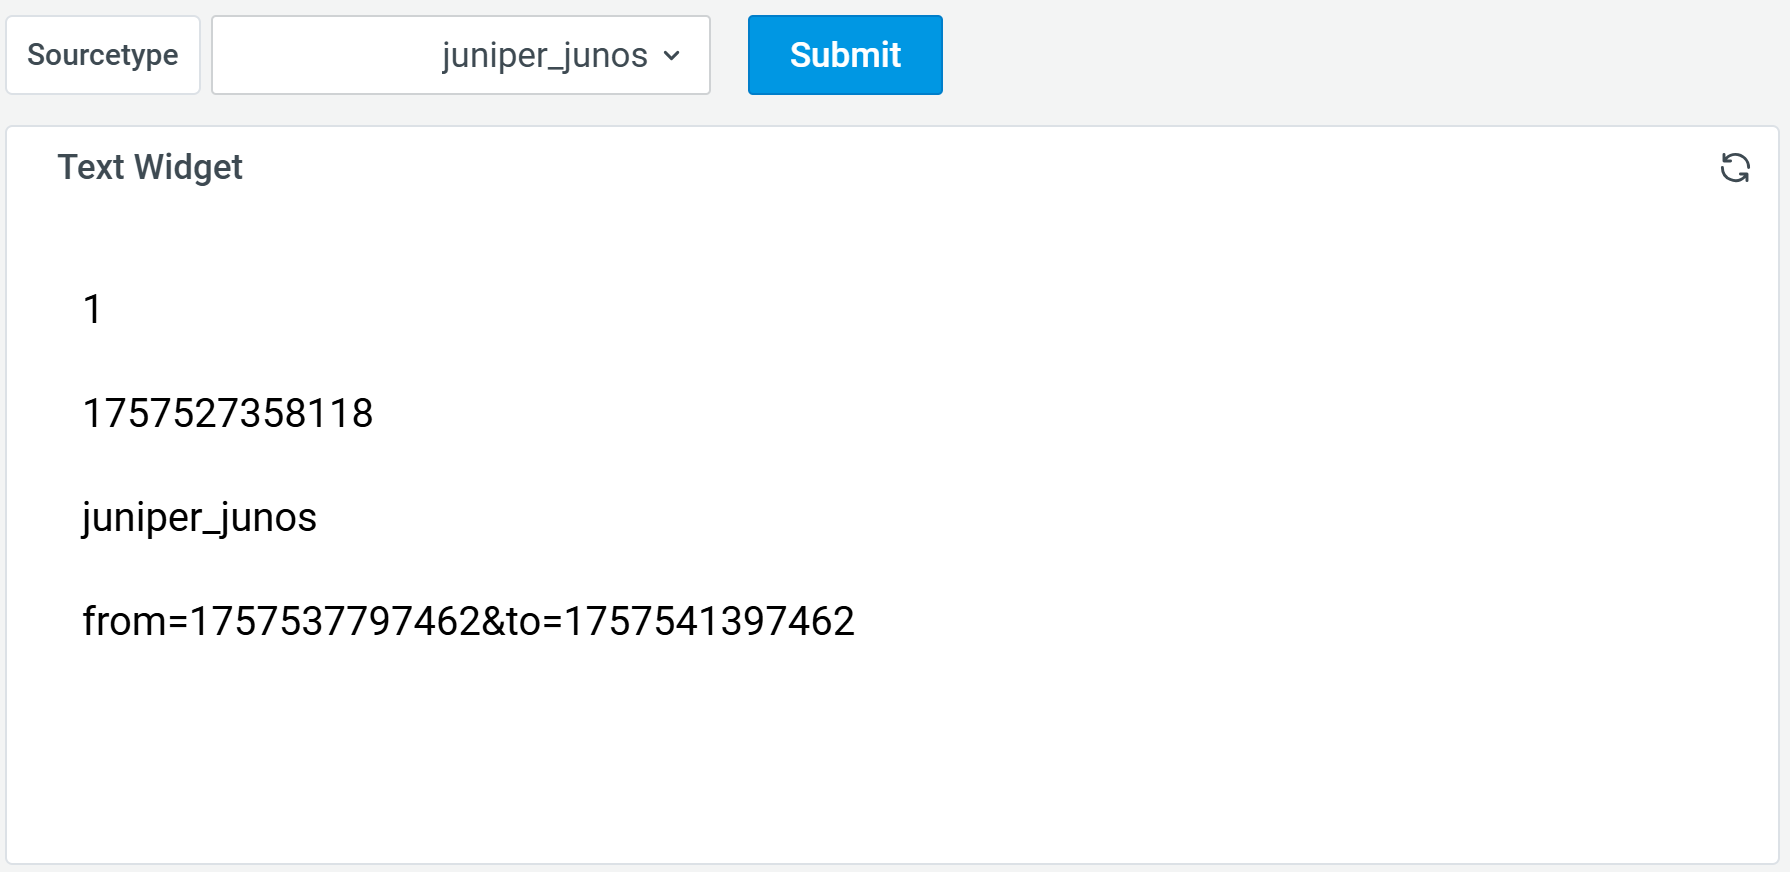
The Markdown widget also supports dynamic variables on Anomali Match Dashboards. You can now insert both system-defined and custom variables into Markdown content, enabling the display of dynamic, context-sensitive information (for example, usernames, dates, alert counts) that updates automatically based on AQL data or user-defined inputs.
How to use variables
Variables can be inserted into your Markdown content using double curly braces:
${enter_your_variable_name}
When the widget is rendered, these placeholders are replaced with their corresponding values.
Adding a variable
See Adding Dashboard Variables to understand how you can add and configure variables.
Dynamic Usage of Variables
After Adding a variable on a dashboard, you can dynamically display their context-specific values as follows:
-
Click Edit on the dashboard.
-
Hover your mosue to the right of the Panel title and click the expander. Doing so displays the panel management menu.
-
Click Edit.
-
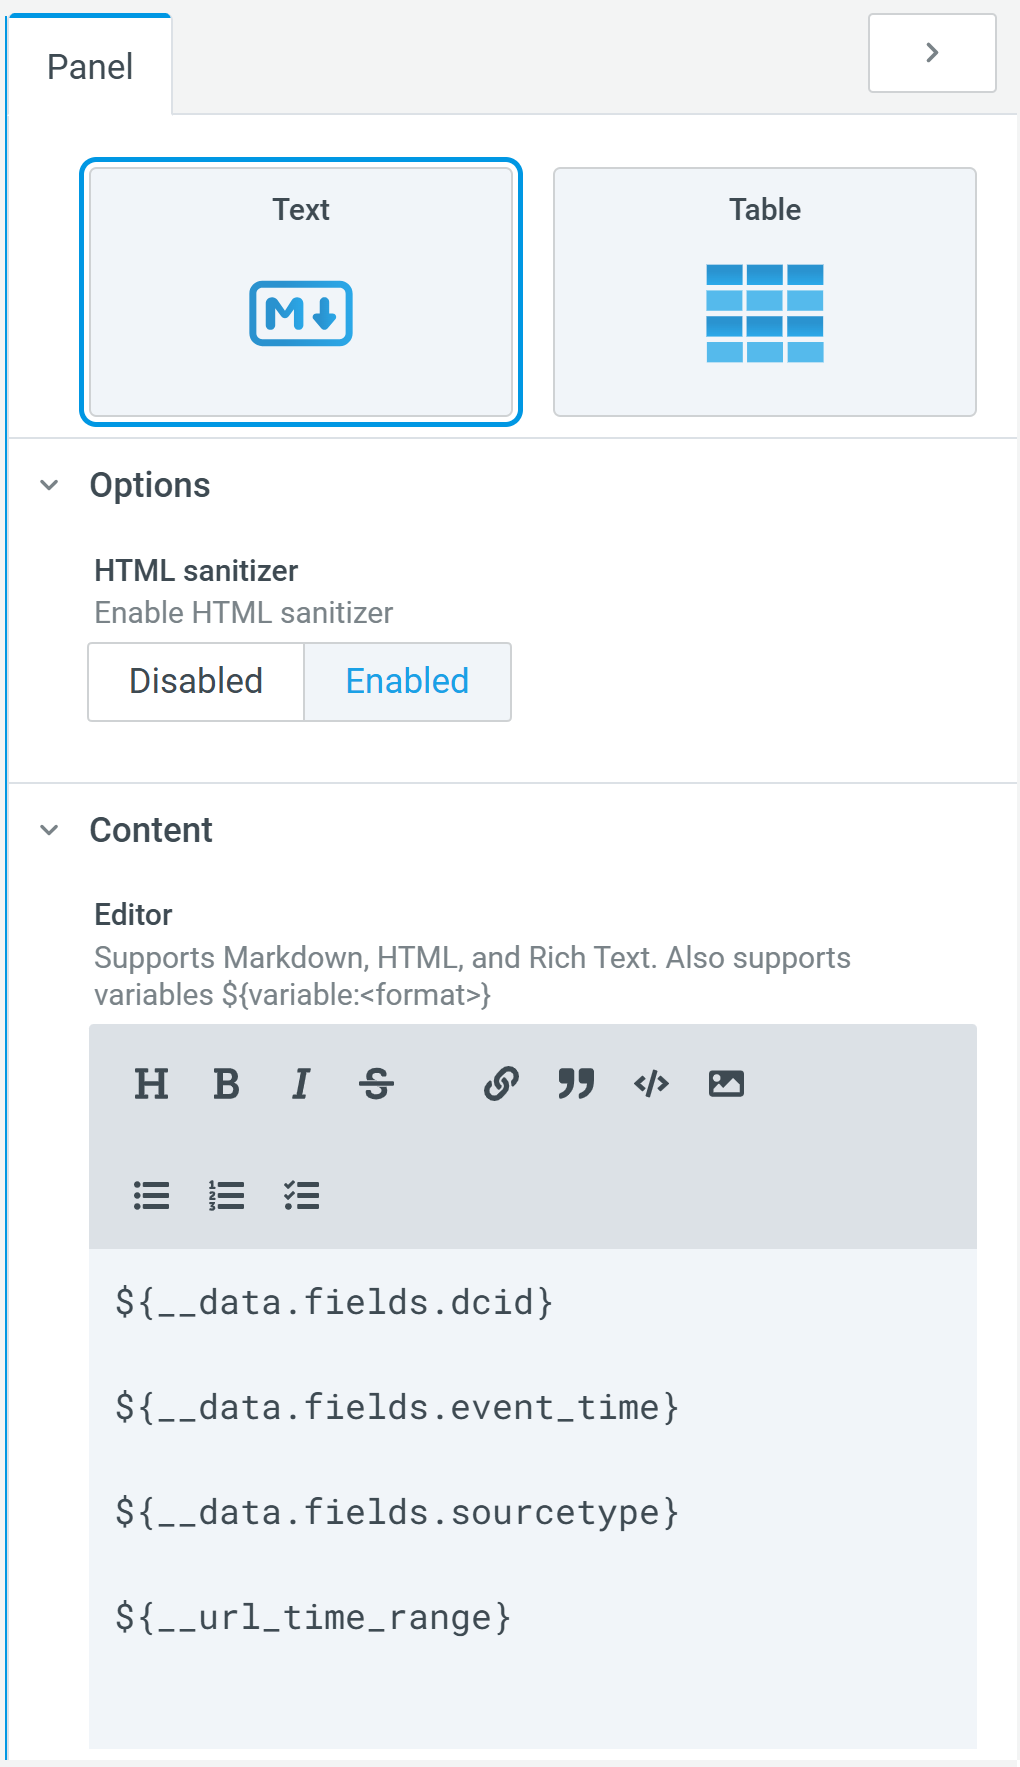
In the Content Editor, enter the dollar sign ($). This sign displays all the system and custom variables that you can use to dynamically display context-specific information. In the example below, we add variables for dcid, event time, sourcetype, and time range.
-
Click Save.
Once you complete these steps, the variable you added will be dynamically populated with its value(s), based on AQL data or user-defined inputs.