About the Linear Regression Visualization Type 
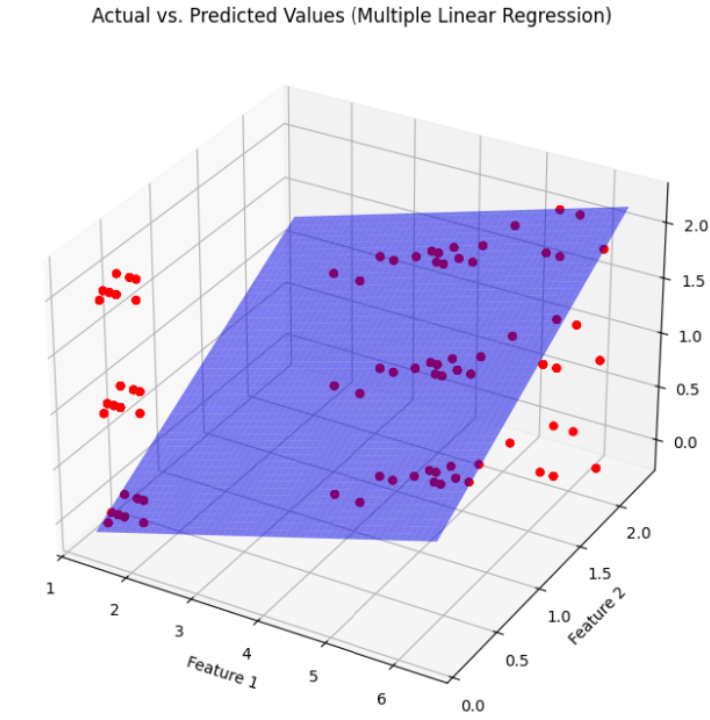
Use the Linear Regression visualization to explore how one or more independent variables relate to a dependent variable, and to evaluate the fit of a linear regression model. The visualization displays the original data as a scatter plot, with a fitted regression line for independent and dependent variables. It also includes optional residuals helping you assess how well the model fits your data.
(Click the image to enlarge it.)
Use case
You can use the Linear Regression visualization to:
-
analyze how a specific feature (for example, connection duration) correlates with an outcome (for example, likelihood of an alert firing), and visually inspect the fitted trend line.
-
examine the combined effect of two variables, such as source IP reputation and destination port on a continuous outcome metric, using a regression plane.
-
inspect residuals, that is the difference between predicted and actual values. to quickly spot non-linear patterns, outliers, or systematic bias in the model.
-
compare multiple linear regression models by visually checking how tightly the data points cluster around the fitted line or surface.
Panel Options
Use the options in the Panel tab to customize the options described in the following table.
| Setting | Description | |
|---|---|---|
| Settings | Panel title | Titles appear at the top of a panel. |
| Description | Descriptions appear as tooltips. Markdown and links are supported. | |
| Transparent | Display panel without a background. | |
| Visualization | Linear Regression |
Select the Linear Regression widget to create linear regression plots.
|
| Display |
Show Model Info |
Display a short message summarizing the model creation result above the chart. |
| Enable Zoom | Allow users to zoom and pan within the chart for closer inspection of specific areas. | |
| Image Scale |
Determines how the image should be scaled within the panel. Possible values are: Contain (fit within panel): Scale the chart to fully fit inside the panel while preserving its aspect ratio. Cover (fill panel): Scale the chart to fill the entire panel, which may crop edges to preserve aspect ratio. Auto (original size): Show the chart at its original size and let it scroll if it does not fit in the panel. |
Examples
Example 1: Visualize single-variable linear regression
| fit OrdinalEncoder action src | fit LinearRegression encoded_action from encoded_src into 'linear_regression_model'Example 2: Visualize single-variable linear regression with residuals
| fit OrdinalEncoder action src | fit LinearRegression encoded_action from encoded_src into 'linear_regression_model2' with_residuals=trueExample 3: Visualize multiple linear regression
| fit OrdinalEncoder action src src_port | fit LinearRegression encoded_action from encoded_src encoded_src_port into 'linear_regression_model3'