About the Decision Tree Visualization Type 
Use the Decision Tree visualization type to intuitively explore and interpret tree-based machine learning models directly within the platform. By providing interactive, graphical representations of decision trees, this feature empowers analysts and data scientists to better understand model logic, validate outcomes, and communicate insights to stakeholders—all without leaving the platform.
This visualization type enables you to examine decision paths, feature importance, and node details, supporting both transparency as well as explainability in machine learning operations.
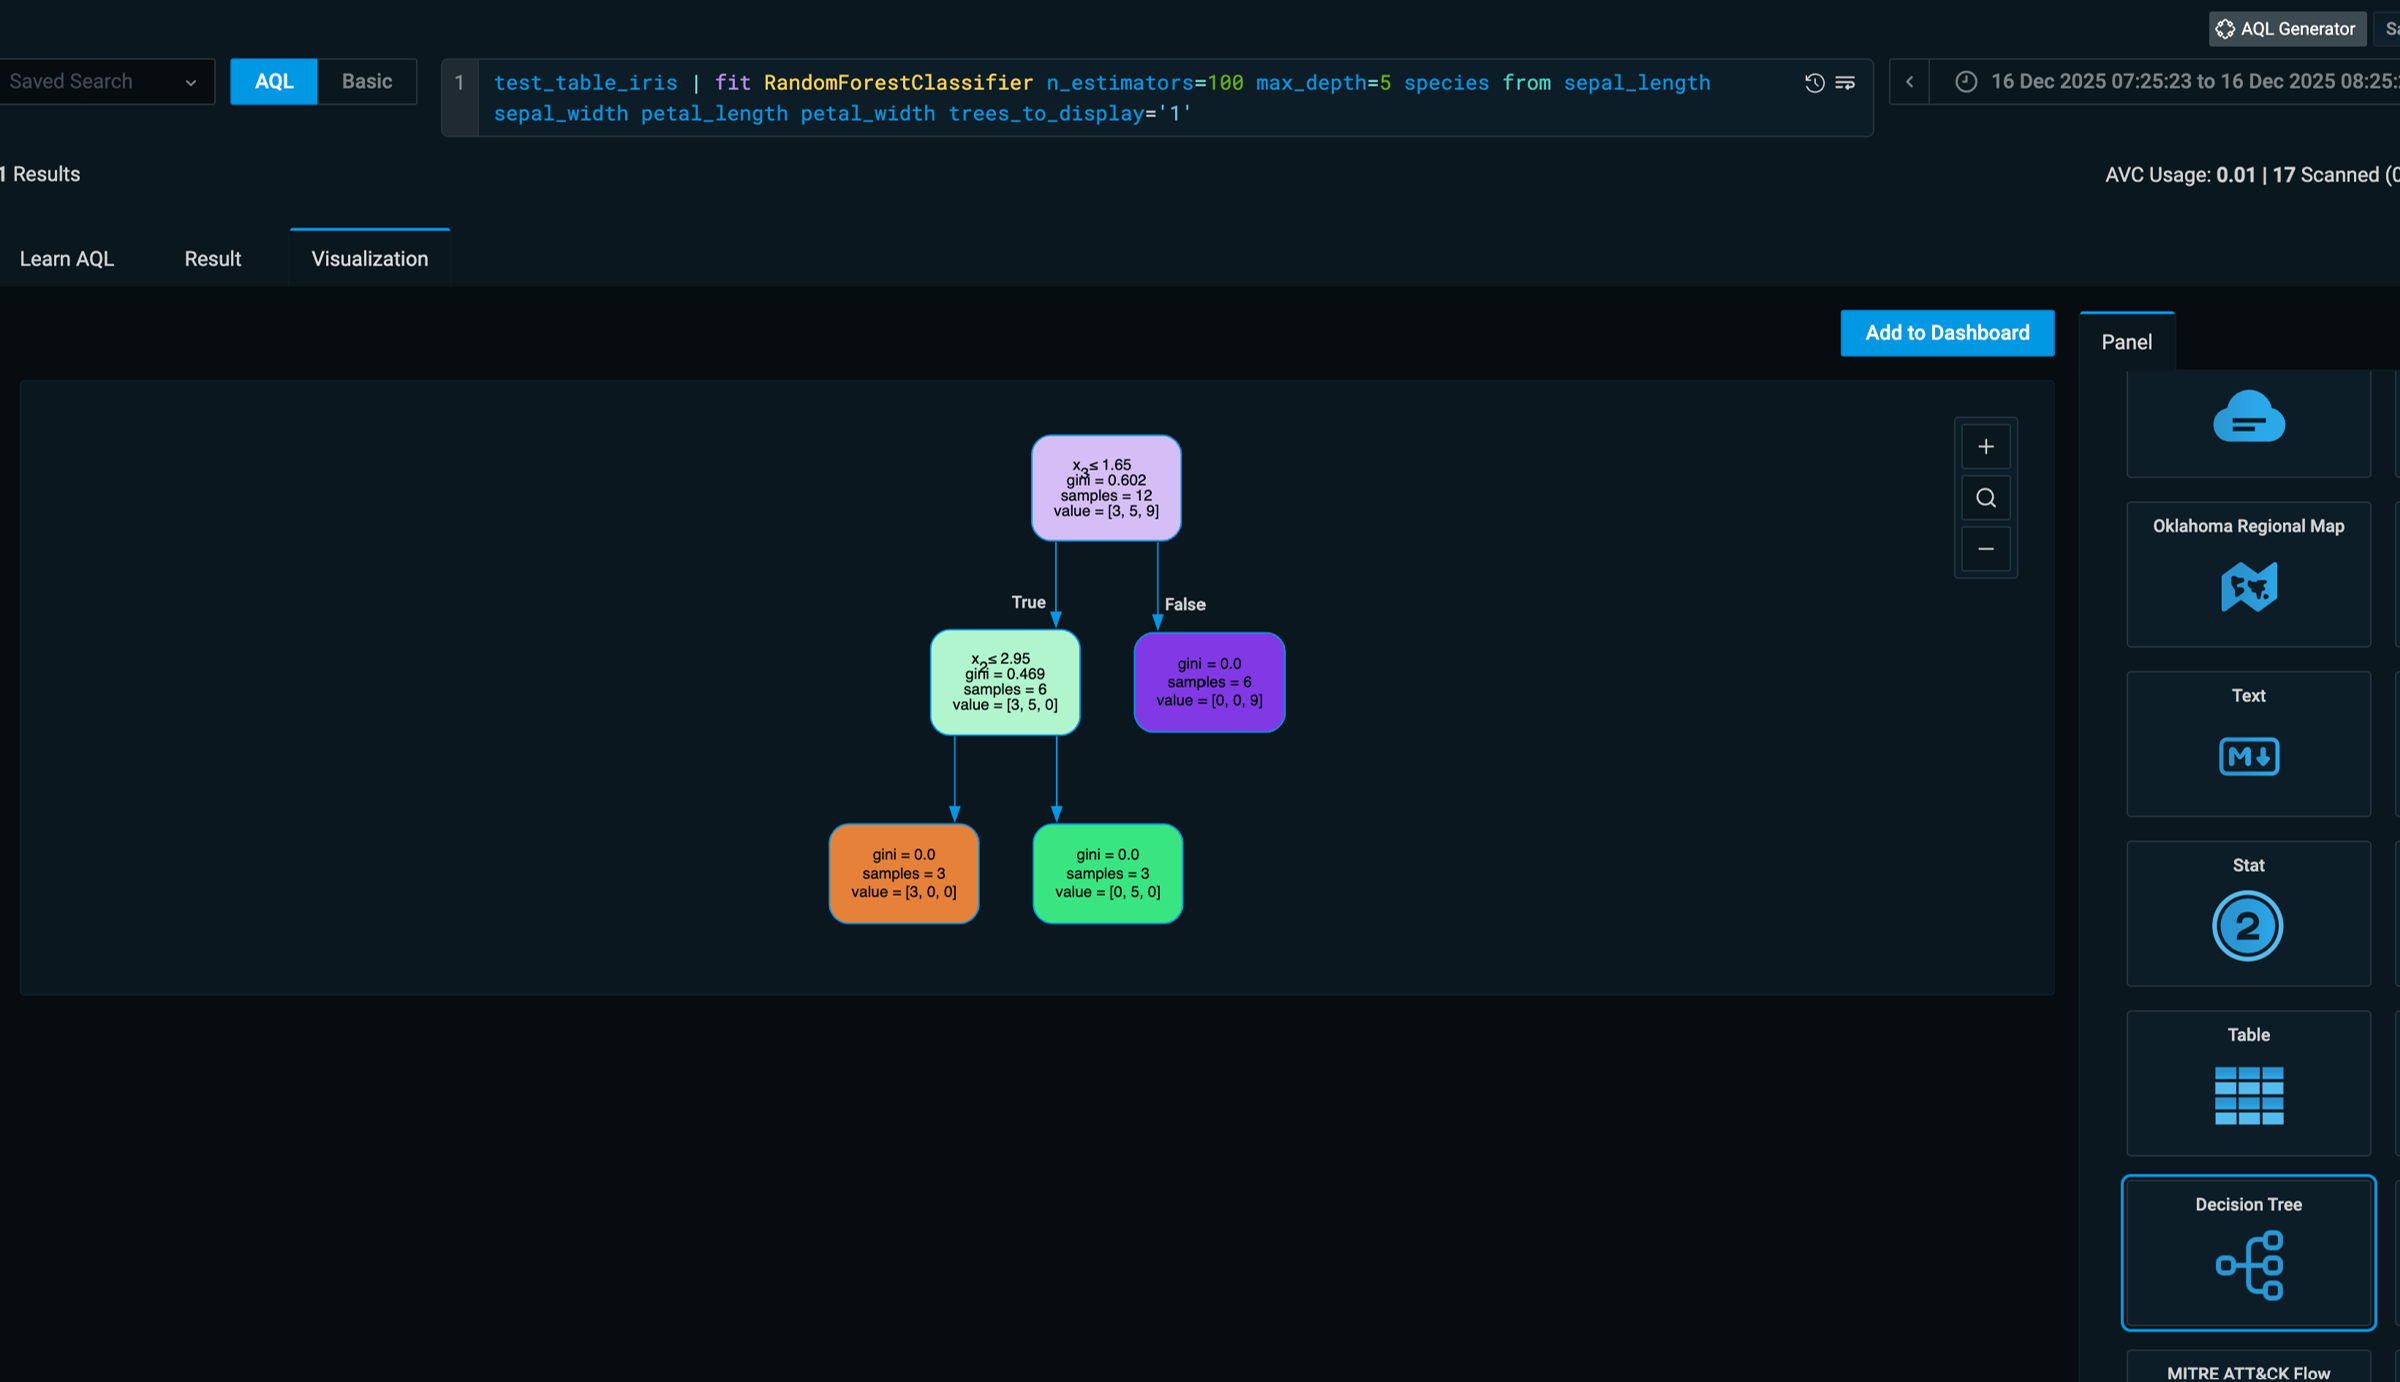
DecisionTreeRegressor and the RandomForestClassifier as AQL keywords.(Click the image to enlarge it.)
Use case
You can use decision trees to:
-
Model Interpretation and Validation: Quickly understand how a decision tree model makes predictions by visually tracing decision paths and examining node splits. This transparency aids in debugging, model validation, and compliance with explainable AI requirements.
-
Feature Importance Analysis: Identify which features most influence model outcomes by inspecting split criteria and feature importance metrics, supporting feature engineering and model refinement.
-
Regulatory and Audit Support: Provide visual evidence of model logic and decision criteria to satisfy regulatory requirements for regulatory transparency in AI systems.
-
Stakeholder Communication: Generate clear, shareable visualizations that help non-technical stakeholders grasp the logic behind model decisions, fostering user reliability and facilitating informed decision-making.
Panel Options
Use the options in the Panel tab to customize the options described in the following table.
| Setting | Description | |
|---|---|---|
| Settings | Panel title | Titles appear at the top of a panel. |
| Description | Descriptions appear as tooltips. Markdown and links are supported. | |
| Transparent | Display panel without a background. | |
| Visualization | Decision Tree |
Select the Decision Tree visualization to create decision trees.
|
| Display |
Show Feature Names |
Toggles display of feature names in decision nodes. |
| Show Class Labels | Toggles display of class labels in the leaf nodes. | |
| Show Impurity Measures | Toggles display of impurity measures (gini, entropy, squared_error). | |
| Show Sample Counts |
Toggles display of the number of samples in each node. |
|
| Max Depth | Sets the maximum depth of the tree to display. | |
| Node Shape | Defines the shape of the tree nodes. | |
| Font Size |
Sets the font size for node labels. |
|
| Tree Direction | Specifies the layout direction of the tree. | |
| Export File Name |
Sets the default file name for exports. |
|
| Enable Zoom |
Toggles allowing zooming in or out of the tree. |
|
| Show Tooltips |
Displays tooltips on hovering over the node. |