Creating Custom Dashboards
To create a custom dashboard:
- Click Dashboard in the top navigation menu.
- Click + Add Dashboard.
-
On the New tab of the Create a New Dashboard window, enter a meaningful Dashboard Name.
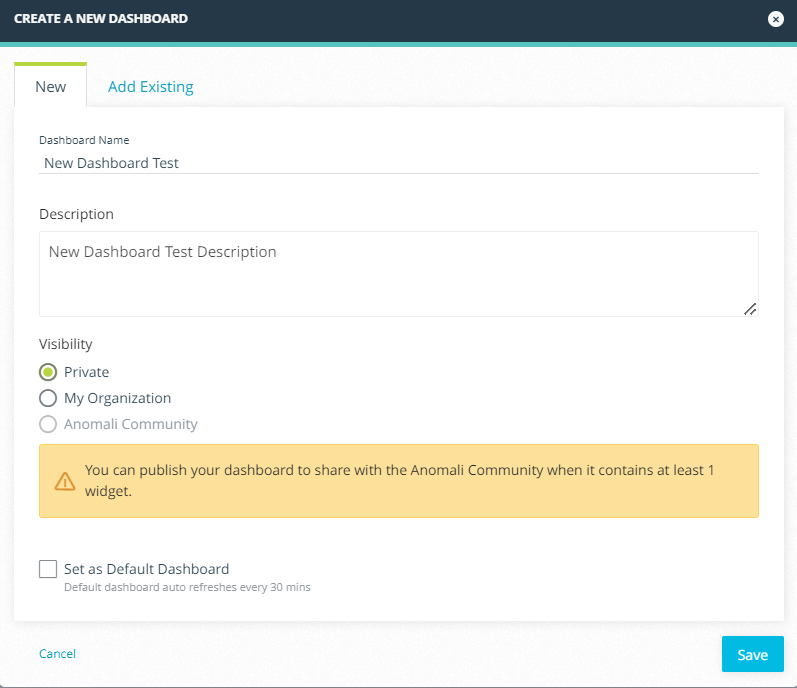 Note: Dashboard names can be no more than 255 characters.
 - (Optional) Enter a dashboard description.
- Select a Visibility setting for the dashboard. Dashboards can be visible only to you (Private) or shared with other users in your organization (My Organization).
- (Optional) Select Set as Default Dashboard if you want the new dashboard to launch automatically each time you navigate to the dashboard page. Default dashboards refresh automatically every 30 minutes.
- Click Save.
You are directed to the new dashboard. New dashboards are blank. You can start displaying desired Threat Intelligence data on your new dashboard through creating new widgets or selecting from a set of default widgets.
The following widget types can be added to custom dashboards:
-
Standard widgets with pre-defined names and built-in query. See Adding Standard Widgets to Custom Dashboards for details.
-
Custom widgets. See Adding Custom Widgets to Custom Dashboards for details.
-
Trending widgets that surface information from Anomali Lens on trending threat intelligence. See Adding Anomali Copilot Trending Widgets to Custom Dashboards for details.
Below is the example of the widget on a custom dashboard:
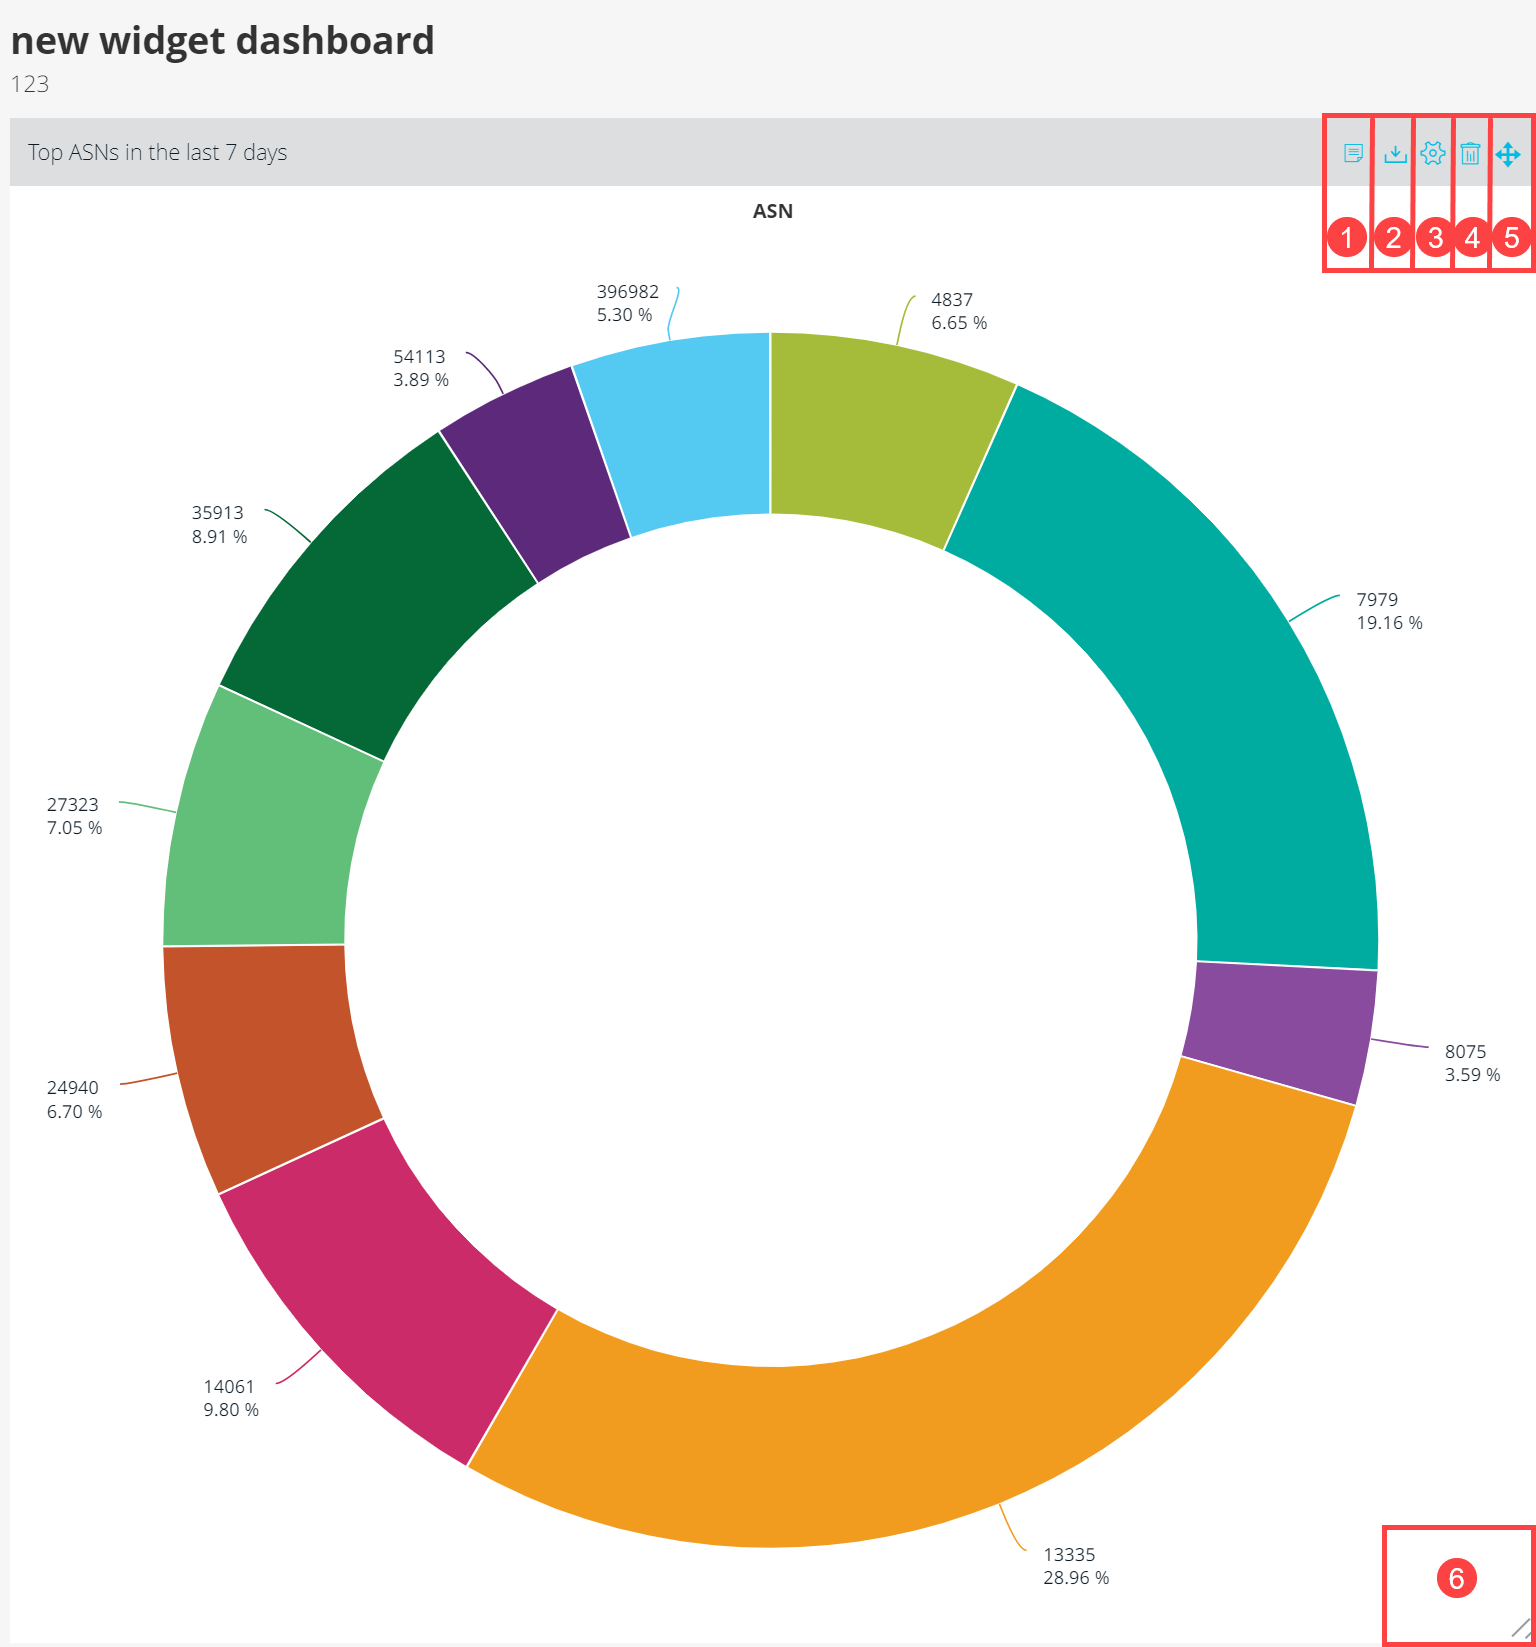
 Create/edit a widget note. Enter a text and click Save Note.

 Export the widget as a PNG file.
 Edit the parameters of the widget. You can edit the widget name, saved search, date range, display type, and a chart field. For the table display type, you can select what table columns you want to be displayed on the widget. On standard and custom widgets, you can also select or deselect the Override Dashboard Range option. When selected the date range of the widget will override the date range set in the custom dashboard.
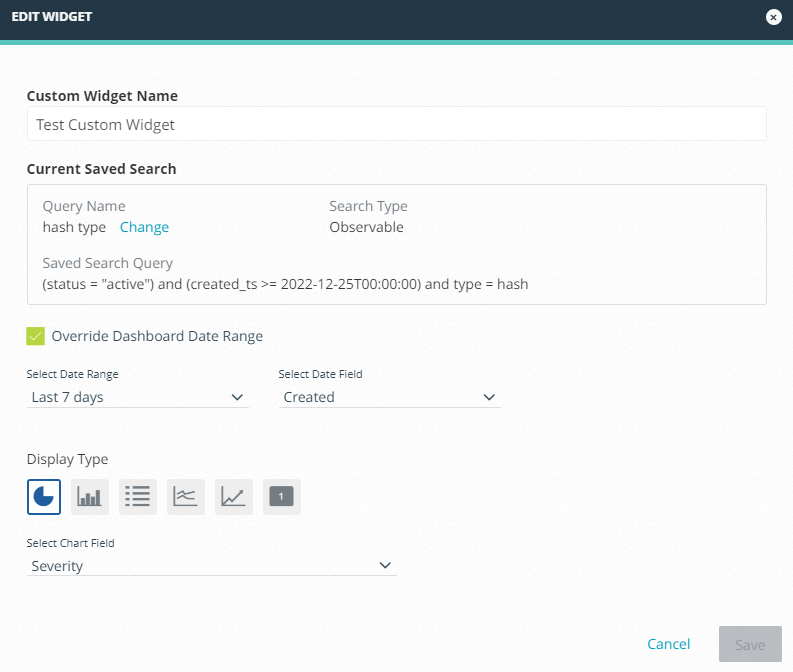
Click Change under Current Saved Search to select a different saved search.
 Remove the widget from your dashboard.
 Change the location of the widget on your dashboard. Click and drag the widget to the desired location.
 Resize the widget.