Adding Custom Widgets to Custom Dashboards
To add custom widgets to a custom dashboard:
-
On your custom dashboard, click + Add a widget or Actions > Add Widget.
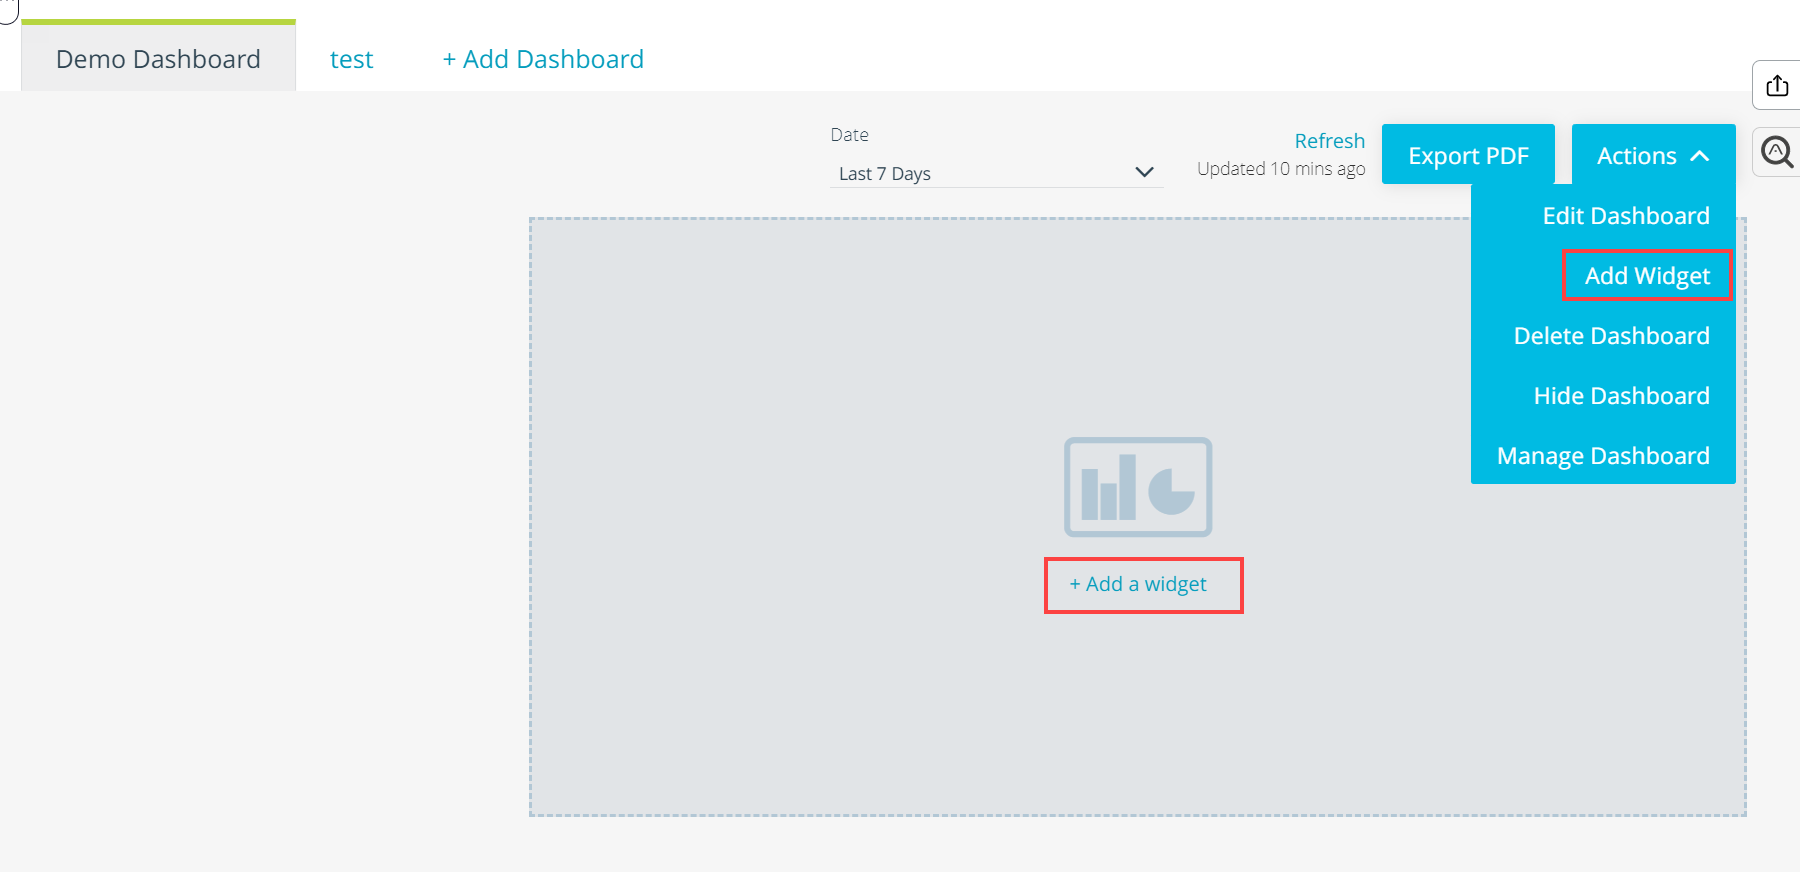 Note: You can only add widgets to custom dashboards which you created. Each dashboard can contain up to 20 widgets.
 -
Navigate to the Custom tab and specify the following parameters.
Field Description Custom Widget Name Name of the new widget. Names can be no more than 255 characters. Select Data Set If you want the new widget to display observable data, select Observables.
If you want the new widget to display Threat Model data, select Threat Models.
Note: Once you create the widget, it cannot be edited to switch between Observable or Threat Model data.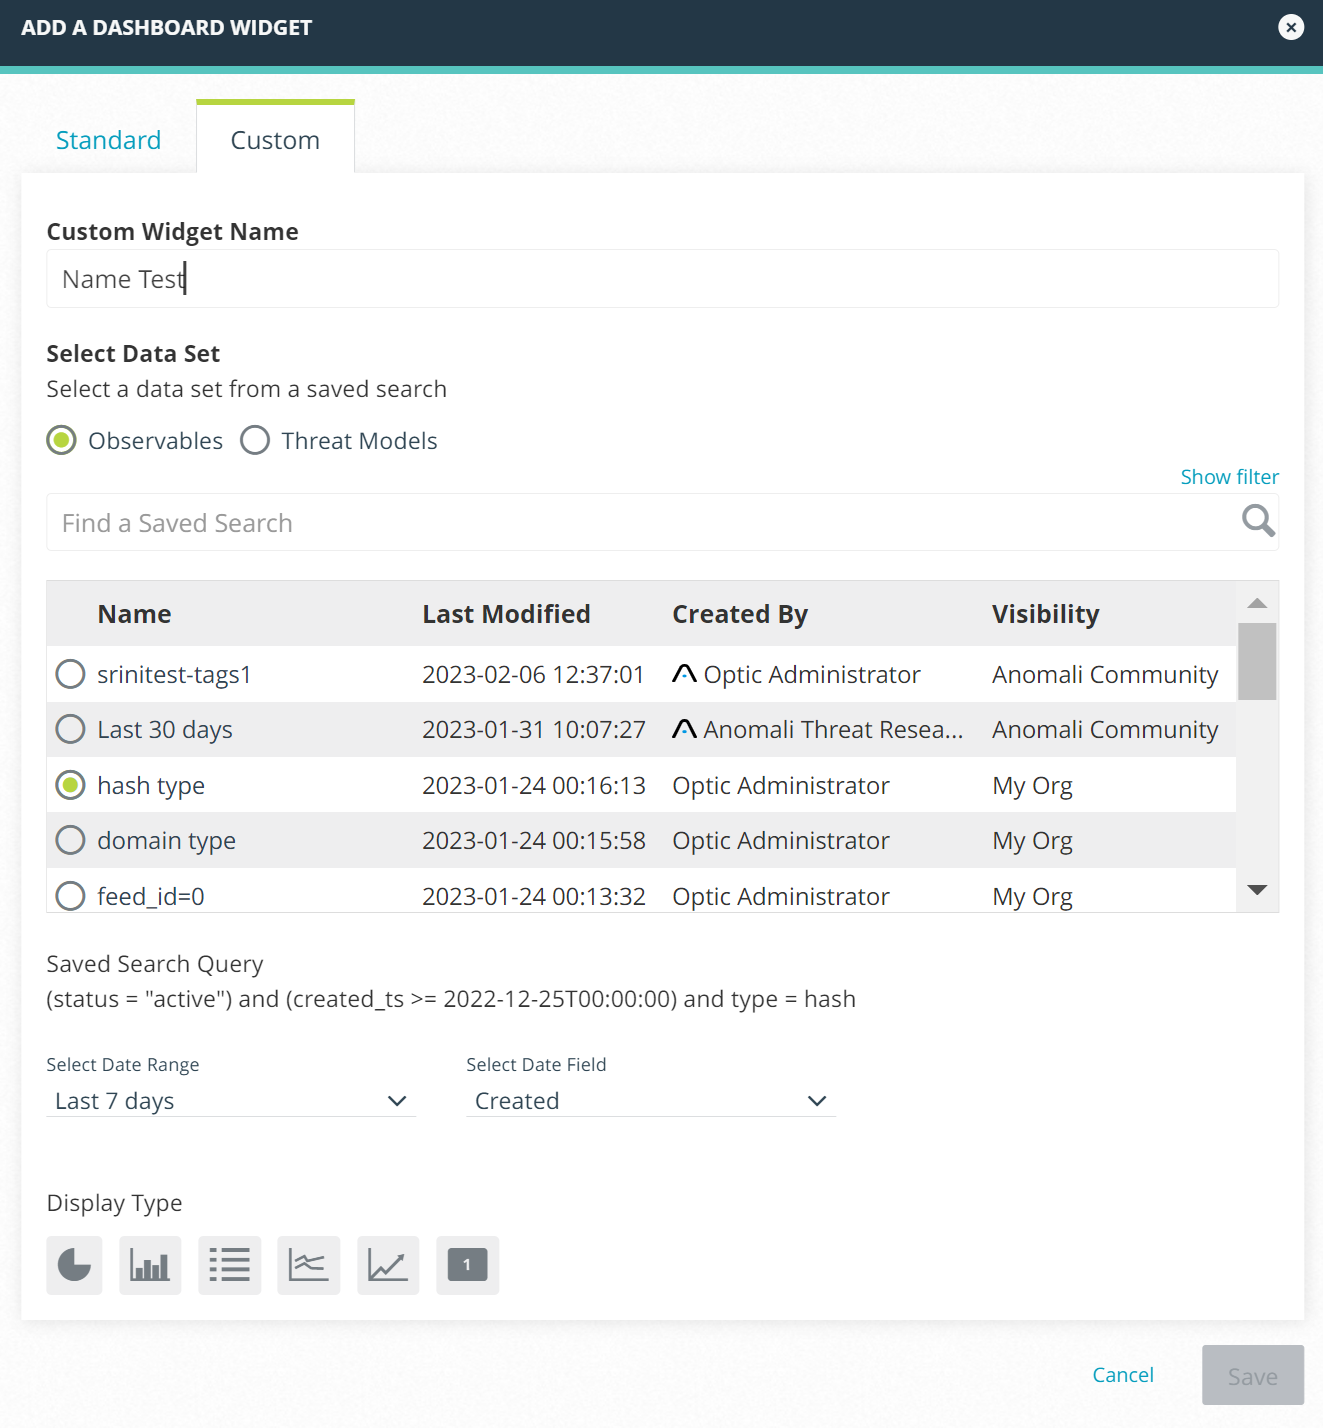
You can use the search function to search for saved search filters by name. Click Show Filter to filter the search results by the last modified date.
When you select a saved search, the filter is displayed below the search results for reference. Anomali recommends using filters that do not include time-based conditions such as
created_tsormodified_ts. Instead, use the Select Date Range and Select Date Field options to set time-based conditions for your widget.For information on creating saved observable searches, see Saving Observable Search Filters.
For information on creating saved Threat Model searches, see Saving Threat Model Search Filters.
Note: For best results, ensure your saved search filter adheres to these Best Practices for Saved Search Filters.Select Date Range Select one of the following date ranges: Last 24 hours, Last 7 days, Last 30 days, Last 60 days, Last 90 days, or Custom.
The selected date range is applied to the data set after the search filter. For example, if the selected search filter returns observables created in the last year and you select Last 7 days, only results from the last 7 days are displayed on the widget.
Note: Since all widgets contain two date constraints—the date range specified by the saved search and the date range selected for the widget—unexpected results can occur when the constraints are not aligned. For example, if today is July 10, 2020, a widget uses a saved search which queries data from January 2020 to June 2020 and you select a widget date range outside these constraints (such as Last 24 Hours), the widget will not display any data as the constraints are out of alignment.Select Date Field Specify whether the selected date range is based on the Created or Modified date of data displayed on the widget. Display Type Select one of the following display types for the widget:
-
 Pie Chart: Displays results as percentages based on a specified parameter.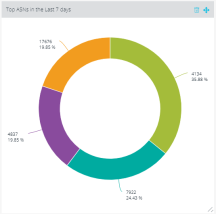
For observables, you can select one of the following Chart Fields for the Pie Chart: iType, Type, Status, Confidence, TLP, Severity, Country, or Stream.
For Threat Model entities, you can select one of the following: Stream/Source, Type, Publication Status, or TLP.
-
 Bar Chart: Displays results as counts based on a specified parameter.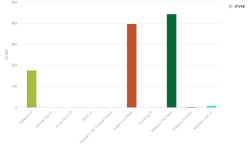
You can select one of the following Chart Fields for the Bar Chart: iType, Type, Status, Confidence, TLP, Severity, Country, or Stream.
For Threat Model entities, you can select one of the following: Stream/Source, Type, Publication Status, or TLP.
-
 Table: Displays results returned for the search filter and specified date range in a table.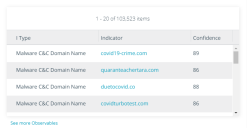
You can select any of the following Table Columns: Date First, Last Modified, Source Created, Source Modified, Expiration Date, iType, Type, Indicator, Status, Confidence, TLP, Import Source, Created By, Severity, Country, Stream, and Tags.
For Threat Model entities, you can select one of the following: Type, Name, Publication Status, TLP, Stream/Source, Visibility, Assignee, Owner, Modified, Created, Date Published, Source Created, Source Modified, CVSS 2.0, or CVSS 3.0.
Tables include See more Observables or See more Threat Models links, through which you can drill into the entire data set on the search screen.
-
 Sparkline Chart: Displays variation of a selected parameter over time.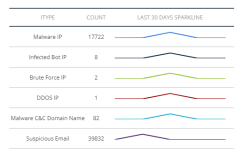
You can select one of the following Chart Fields for the Sparkline Chart: iType, Type, Status, Confidence, TLP, Severity, Country, or Stream.
For Threat Model entities, you can select one of the following: Stream/Source, Type, Publication Status, or TLP.
-
 Trend Chart: Displays trend of a selected parameter over time in a stacked line chart.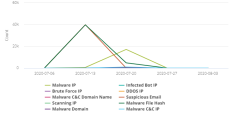
You can select one of the following Chart Fields for the Trend Chart to visualize: iType, Type, Status, Confidence, TLP, Severity, Country, or Stream.
For Threat Model entities, you can select one of the following: Stream/Source, Type, Publication Status, or TLP.
-
 Number Chart: Displays a count of results in the dataset.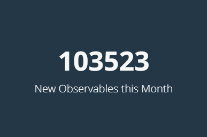
Use the Background Color menu to select a color for the widget.
-
-
Click Save. The widget is added to the dashboard.