On This Page:
In This Section:
Viewing Asset Details
The Asset Details panel provides a complete profile of a single asset entity, including its current risk score, active detections, field-level details, group memberships, and activity history. To open it, click any asset hostname in the Assets list.
The panel header displays the asset hostname, status, source, and current risk score.
When opened in full-page mode, a summary panel on the left displays key fields: Hostname, Asset Type, OS, Environment, Risk Level, Source, Status, and Last Seen.
All the asset data is organize across the following tabs:
Overview Tab
The Overview tab summarizes the risk posture of an asset and displays its profile fields.
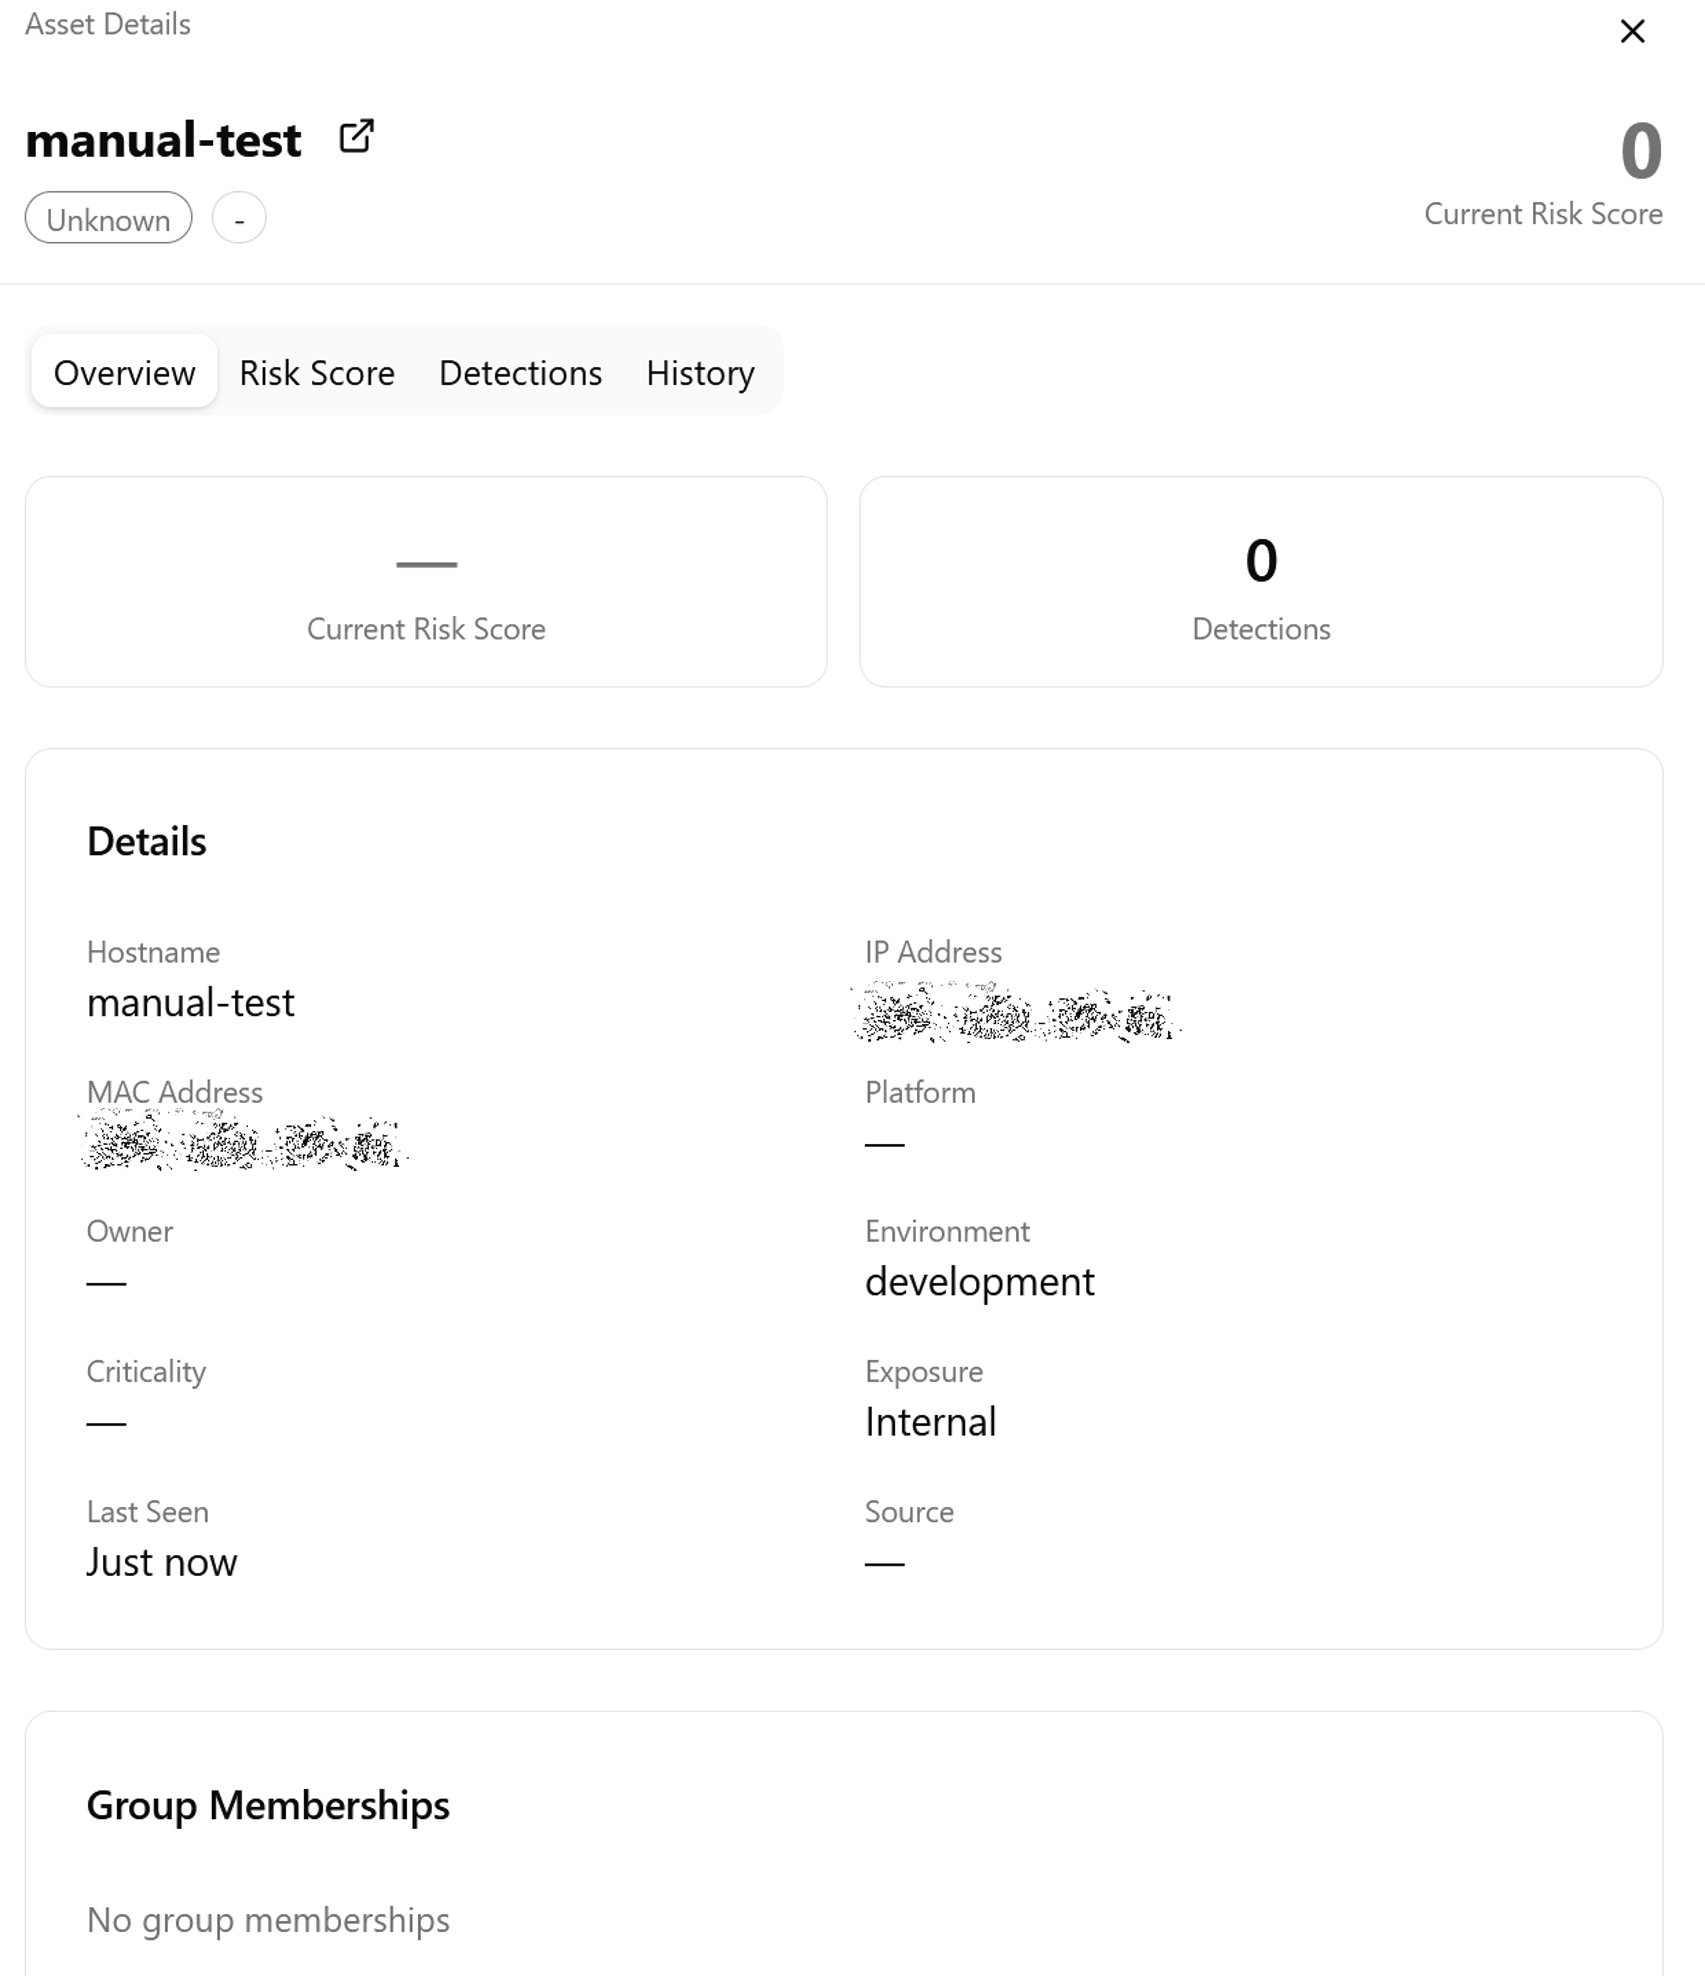
The top of the tab shows two summary cards: Risk Score, the current score of the asset on a 0–100 scale, and Detections, the number of active detections within the rolling 24-hour window.
The Details section lists the asset profile fields:
-
Hostname and IP Address
-
MAC Address and Platform
-
Owner and Environment
-
Criticality and Exposure
-
Last Seen and Source
The Group Memberships section lists the peer groups to which this asset belongs. Each entry displays the group name, the source system from which the group was synchronized, and the current risk score multiplier of the group (for example, ×1.0).
Group memberships determine which peer group risk multipliers apply to the score for this asset.
See Peer Groups for more information.
Risk Score Tab
The Risk Score tab shows the score history of the asset and provides controls to configure its entity risk override.
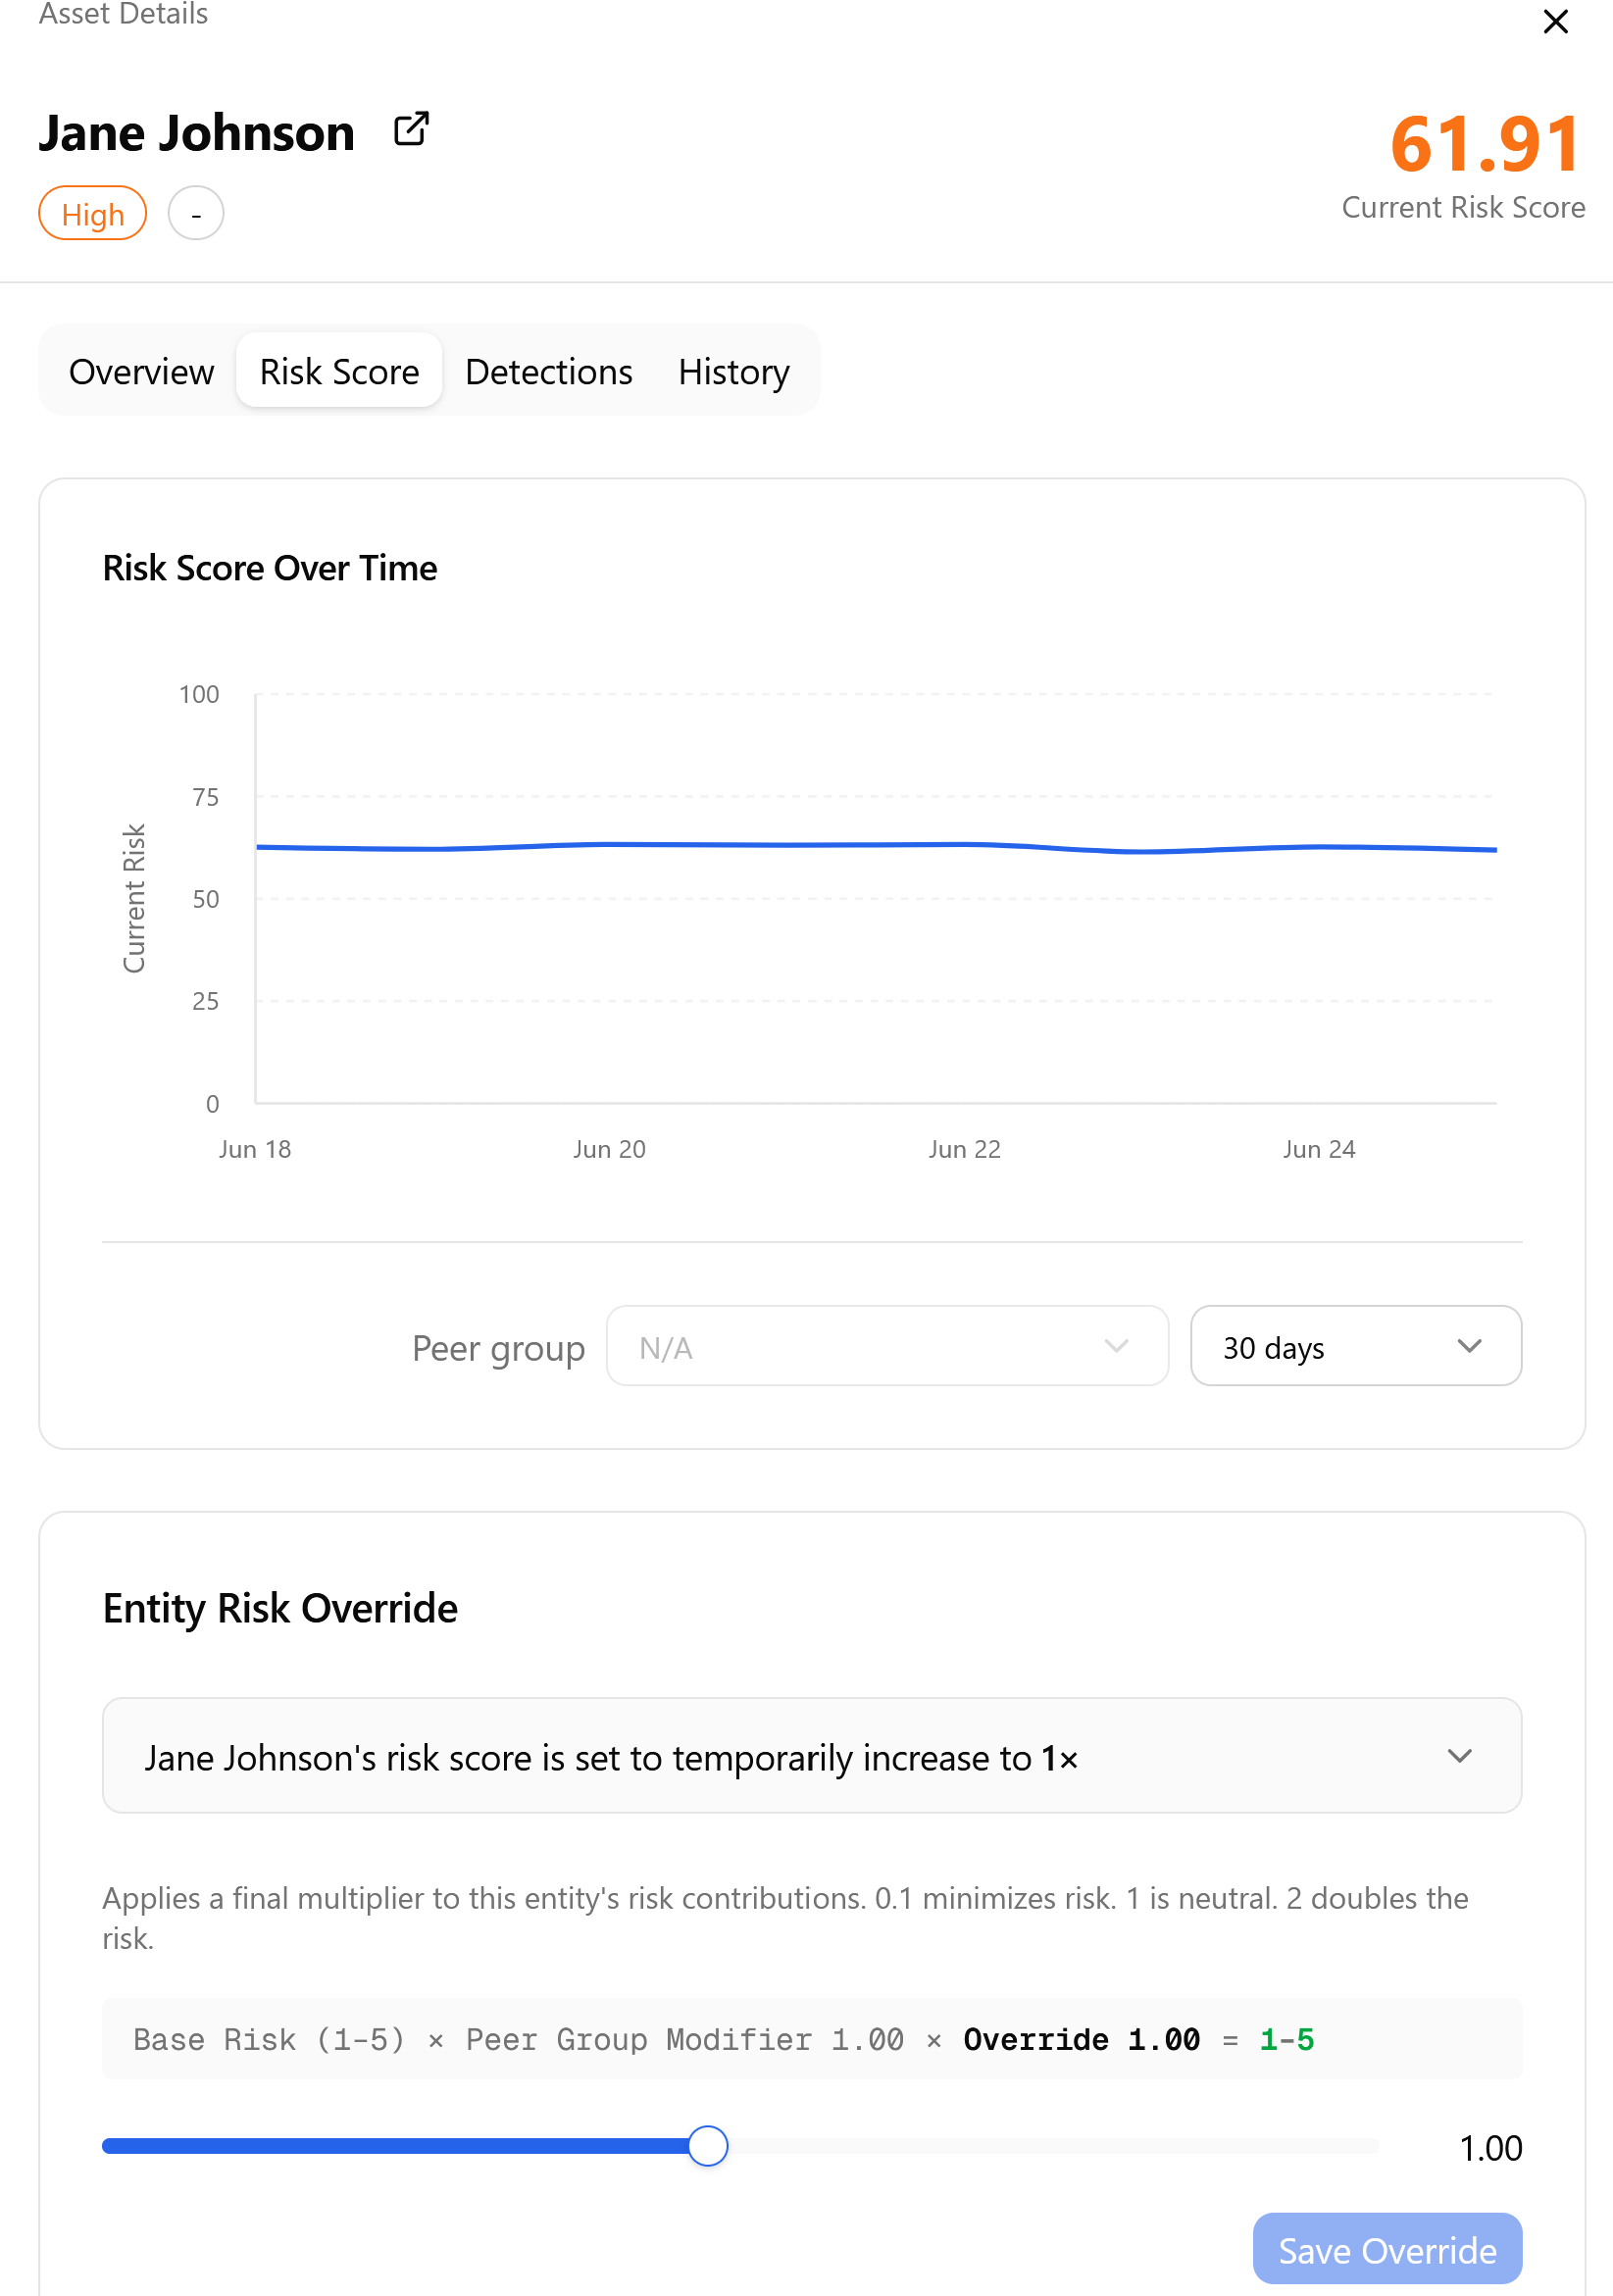
Risk Score Over Time
The Risk Score Over Time chart plots the current risk score of the asset across a selected time period. Use the Peer group drop-down to view how scoring varies in a group context, and the time period drop-down to adjust the chart window, for example, 30 days.
Entity Risk Override
The Entity Risk Override section applies a final multiplier to the risk contributions of the asset. The override range is 0.1 to 2.0, where 0.1 minimizes risk, 1.0 is the default and indicates neutral risk, and 2.0 doubles the risk.
Note: Changing the override requires the Manage Entities permission. Viewing the asset detail page, including its risk score and override value, requires View Entities or higher.
The following formula displayed shows how the override compounds with the base risk and peer group modifier:
Base Risk (1–5) × Peer Group Modifier × Override = Result.
Adjust the slider to the desired value and click Save Override to apply.
See Entity Risk Score Override for more information.
Detections Tab
The Detections tab lists all active detections associated with this asset within the current 24-hour window.
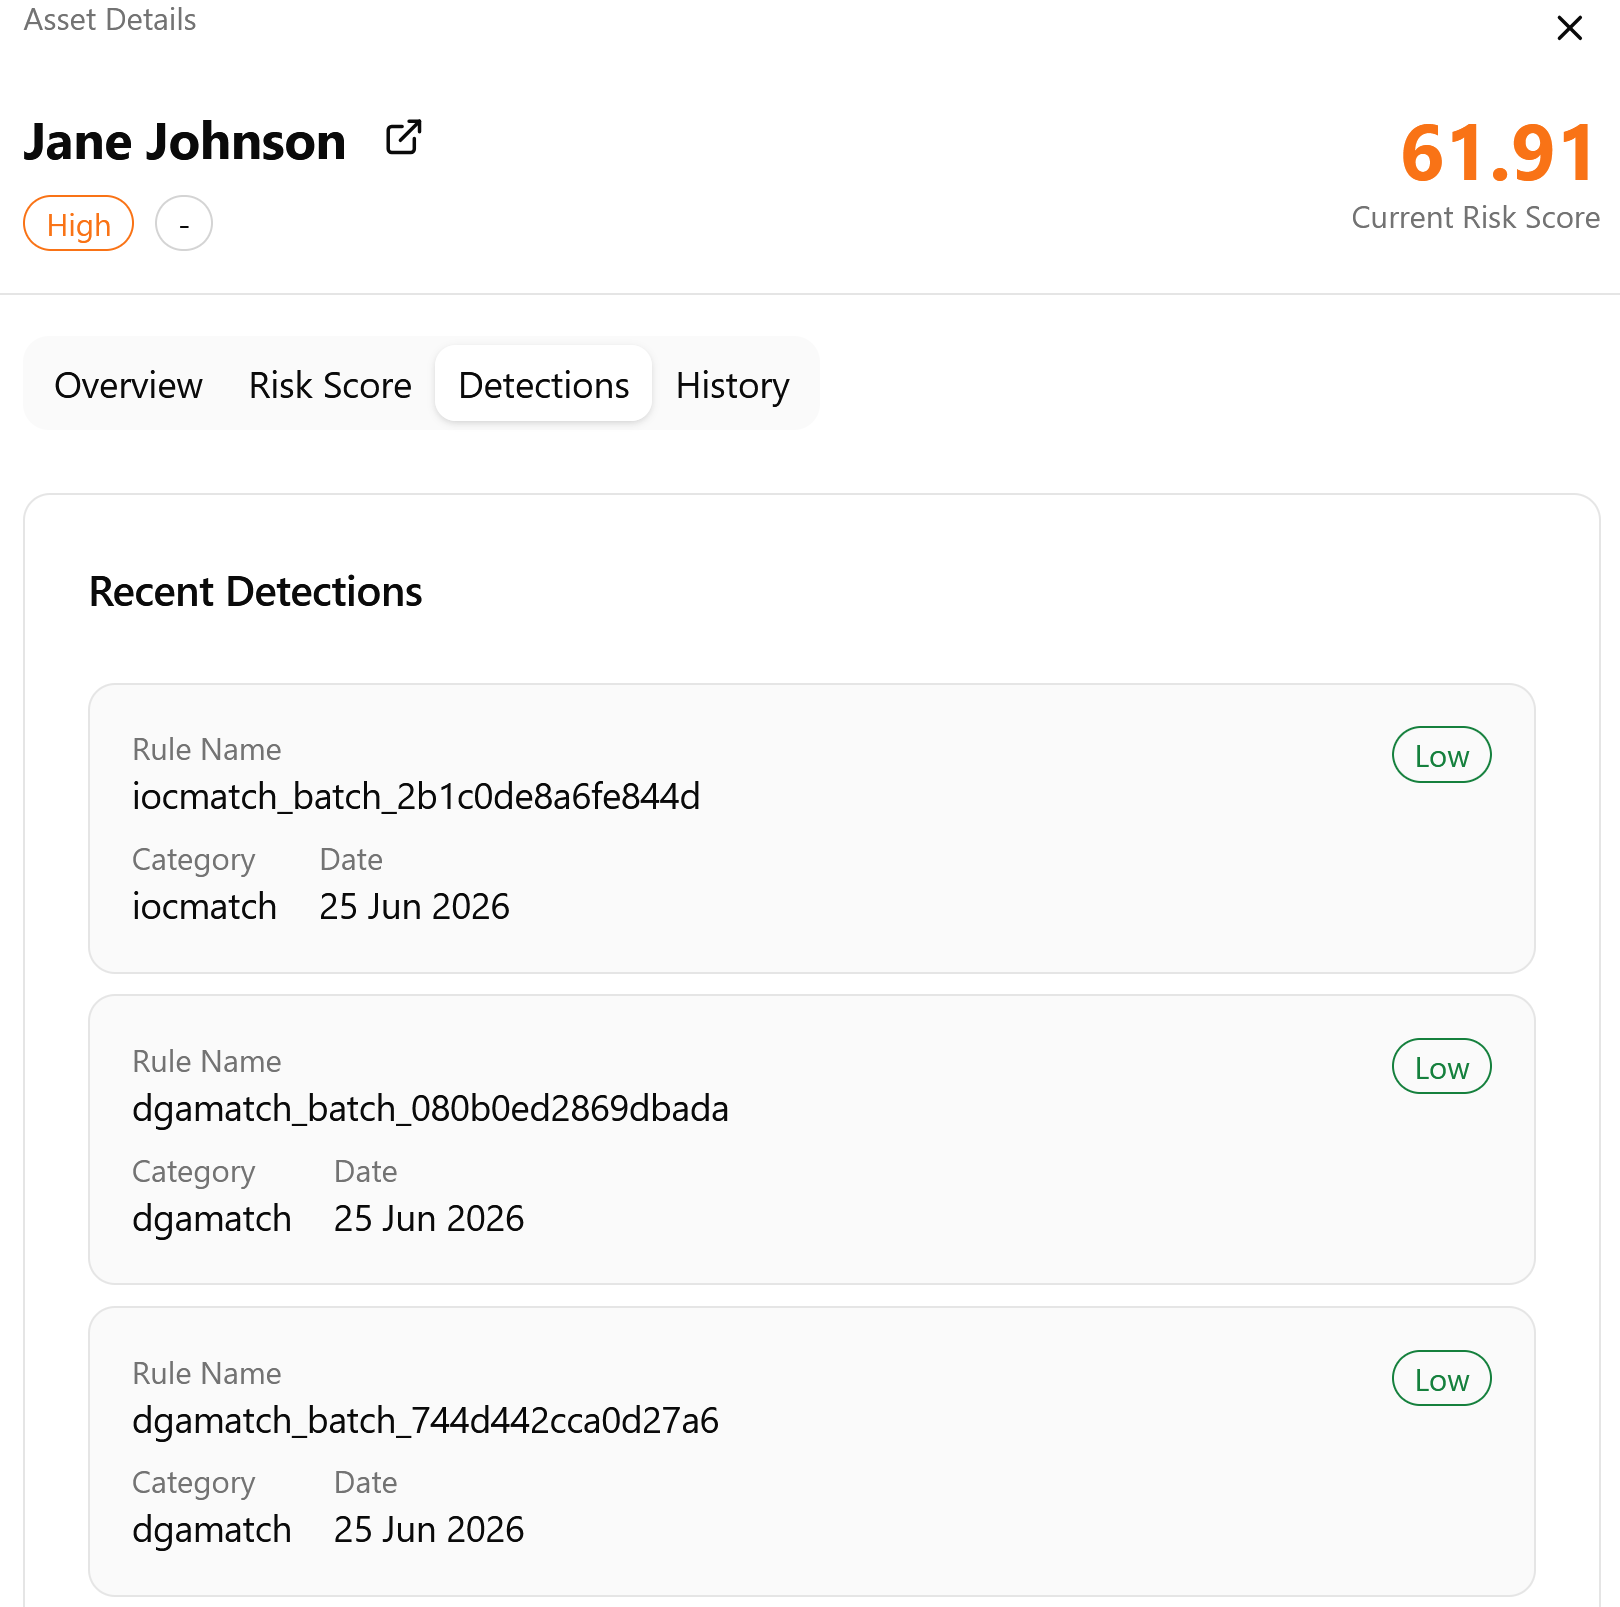
Each detection card in the Recent Detections list displays the Rule Name that fired the detection, the detection severity (for example, Low, Medium, High), its Category, and the Date the detection was recorded. Detections expire from this list 24 hours after they fire.
See Entity Risk Scores for more information.
History Tab
The History tab provides a chronological record of all events and changes associated with this asset.
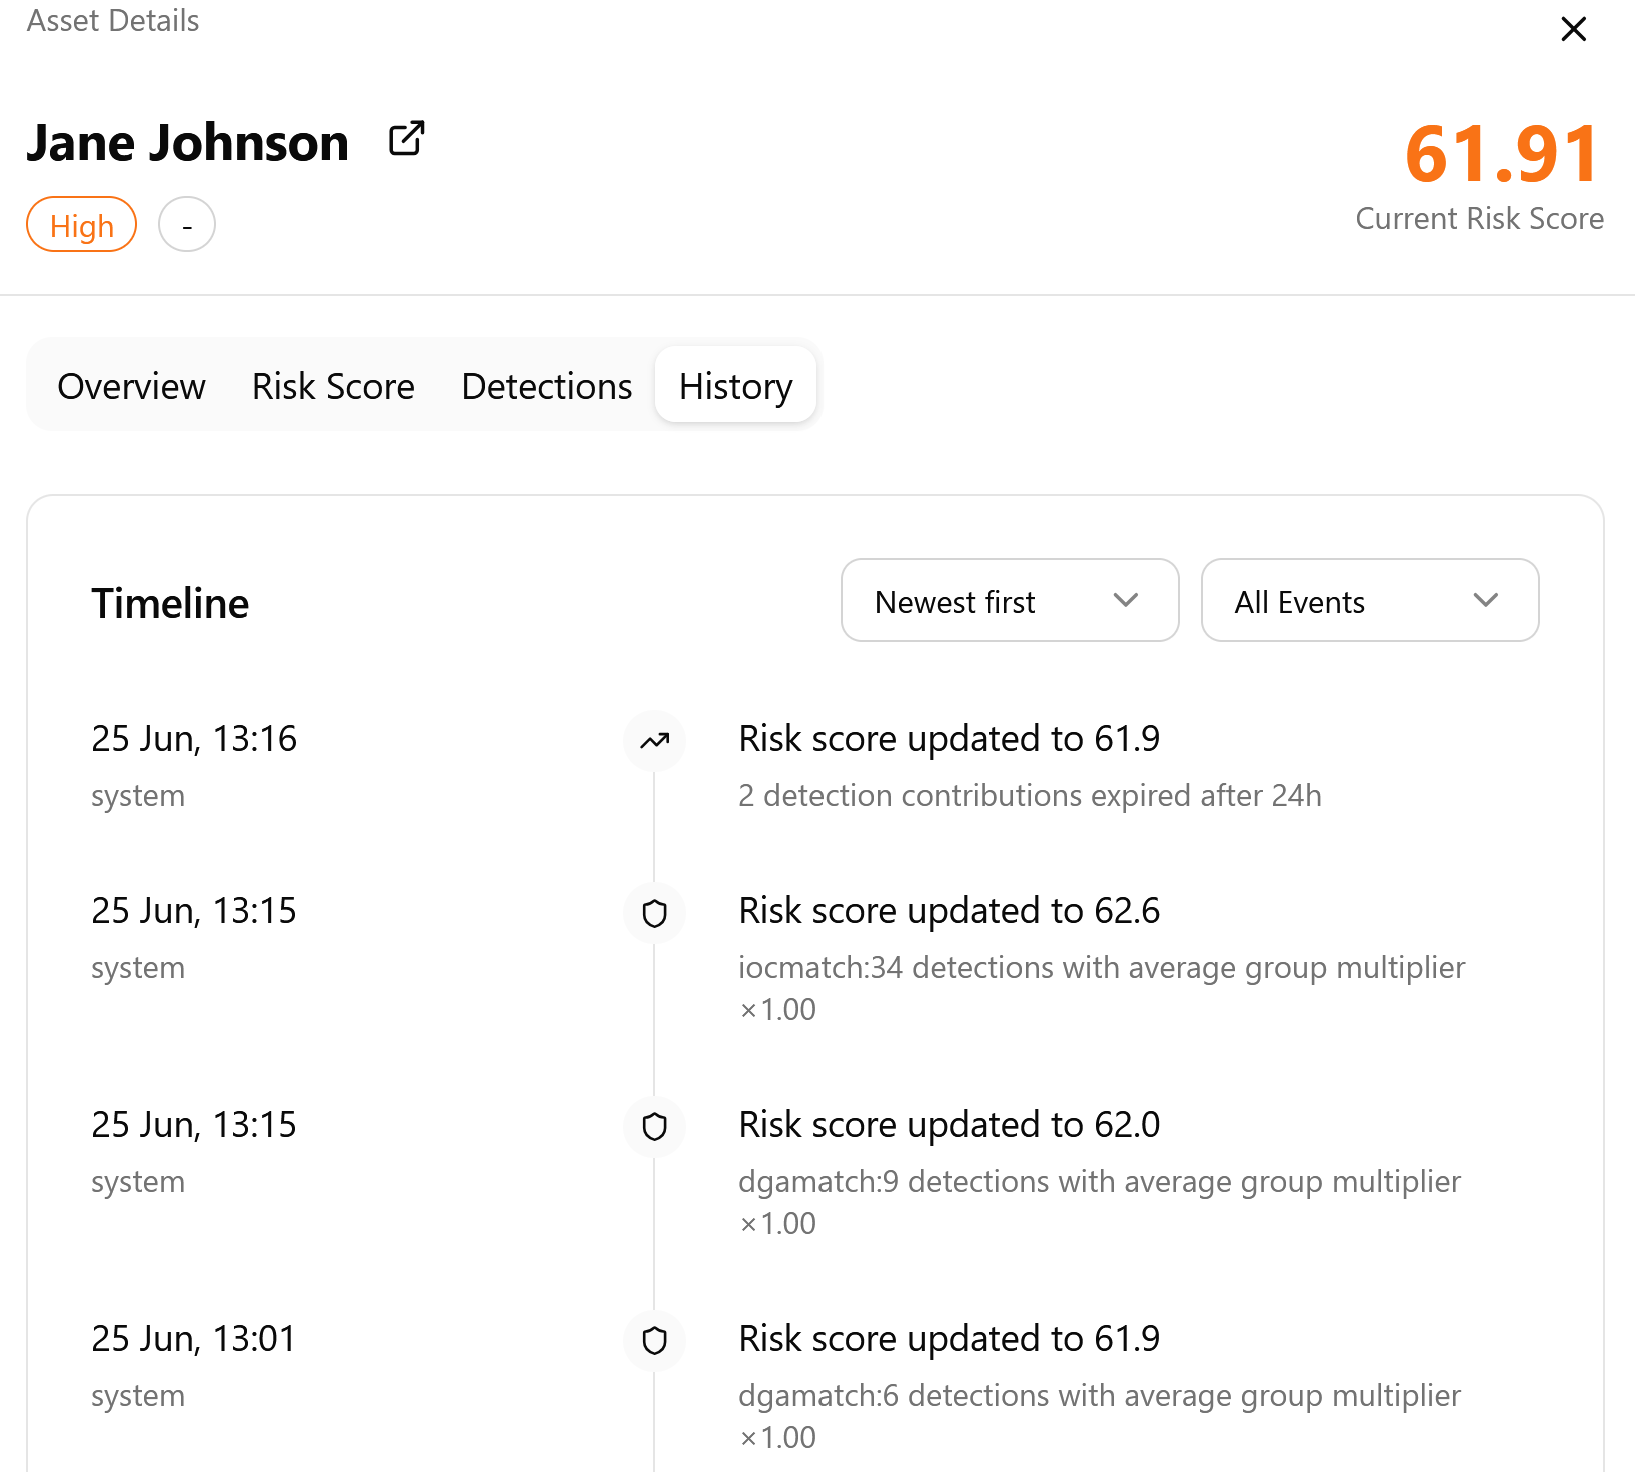
The Timeline lists events in reverse chronological order by default. Use the sort drop-down to switch between Newest first and Oldest first.
Use the event type filter to narrow results: All Events, Actions, or Detections. Each entry shows the timestamp, the user or system that generated the event, and the event description.