Viewing Agent Details
Each agent details page gives you a single, transparent view into everything that the agent has done and is authorized to do. Every action, reasoning step, tool call, and recommendation made by an agent is logged and auditable, so you can always see why it took a given action.
To access details of an agent, navigate to Anomali Agentic Fleet > Fleet Overview > My Agents and select the agent you want to review.
Below is an example of the Alert Triage Agent.
(Click the image to enlarge it.)
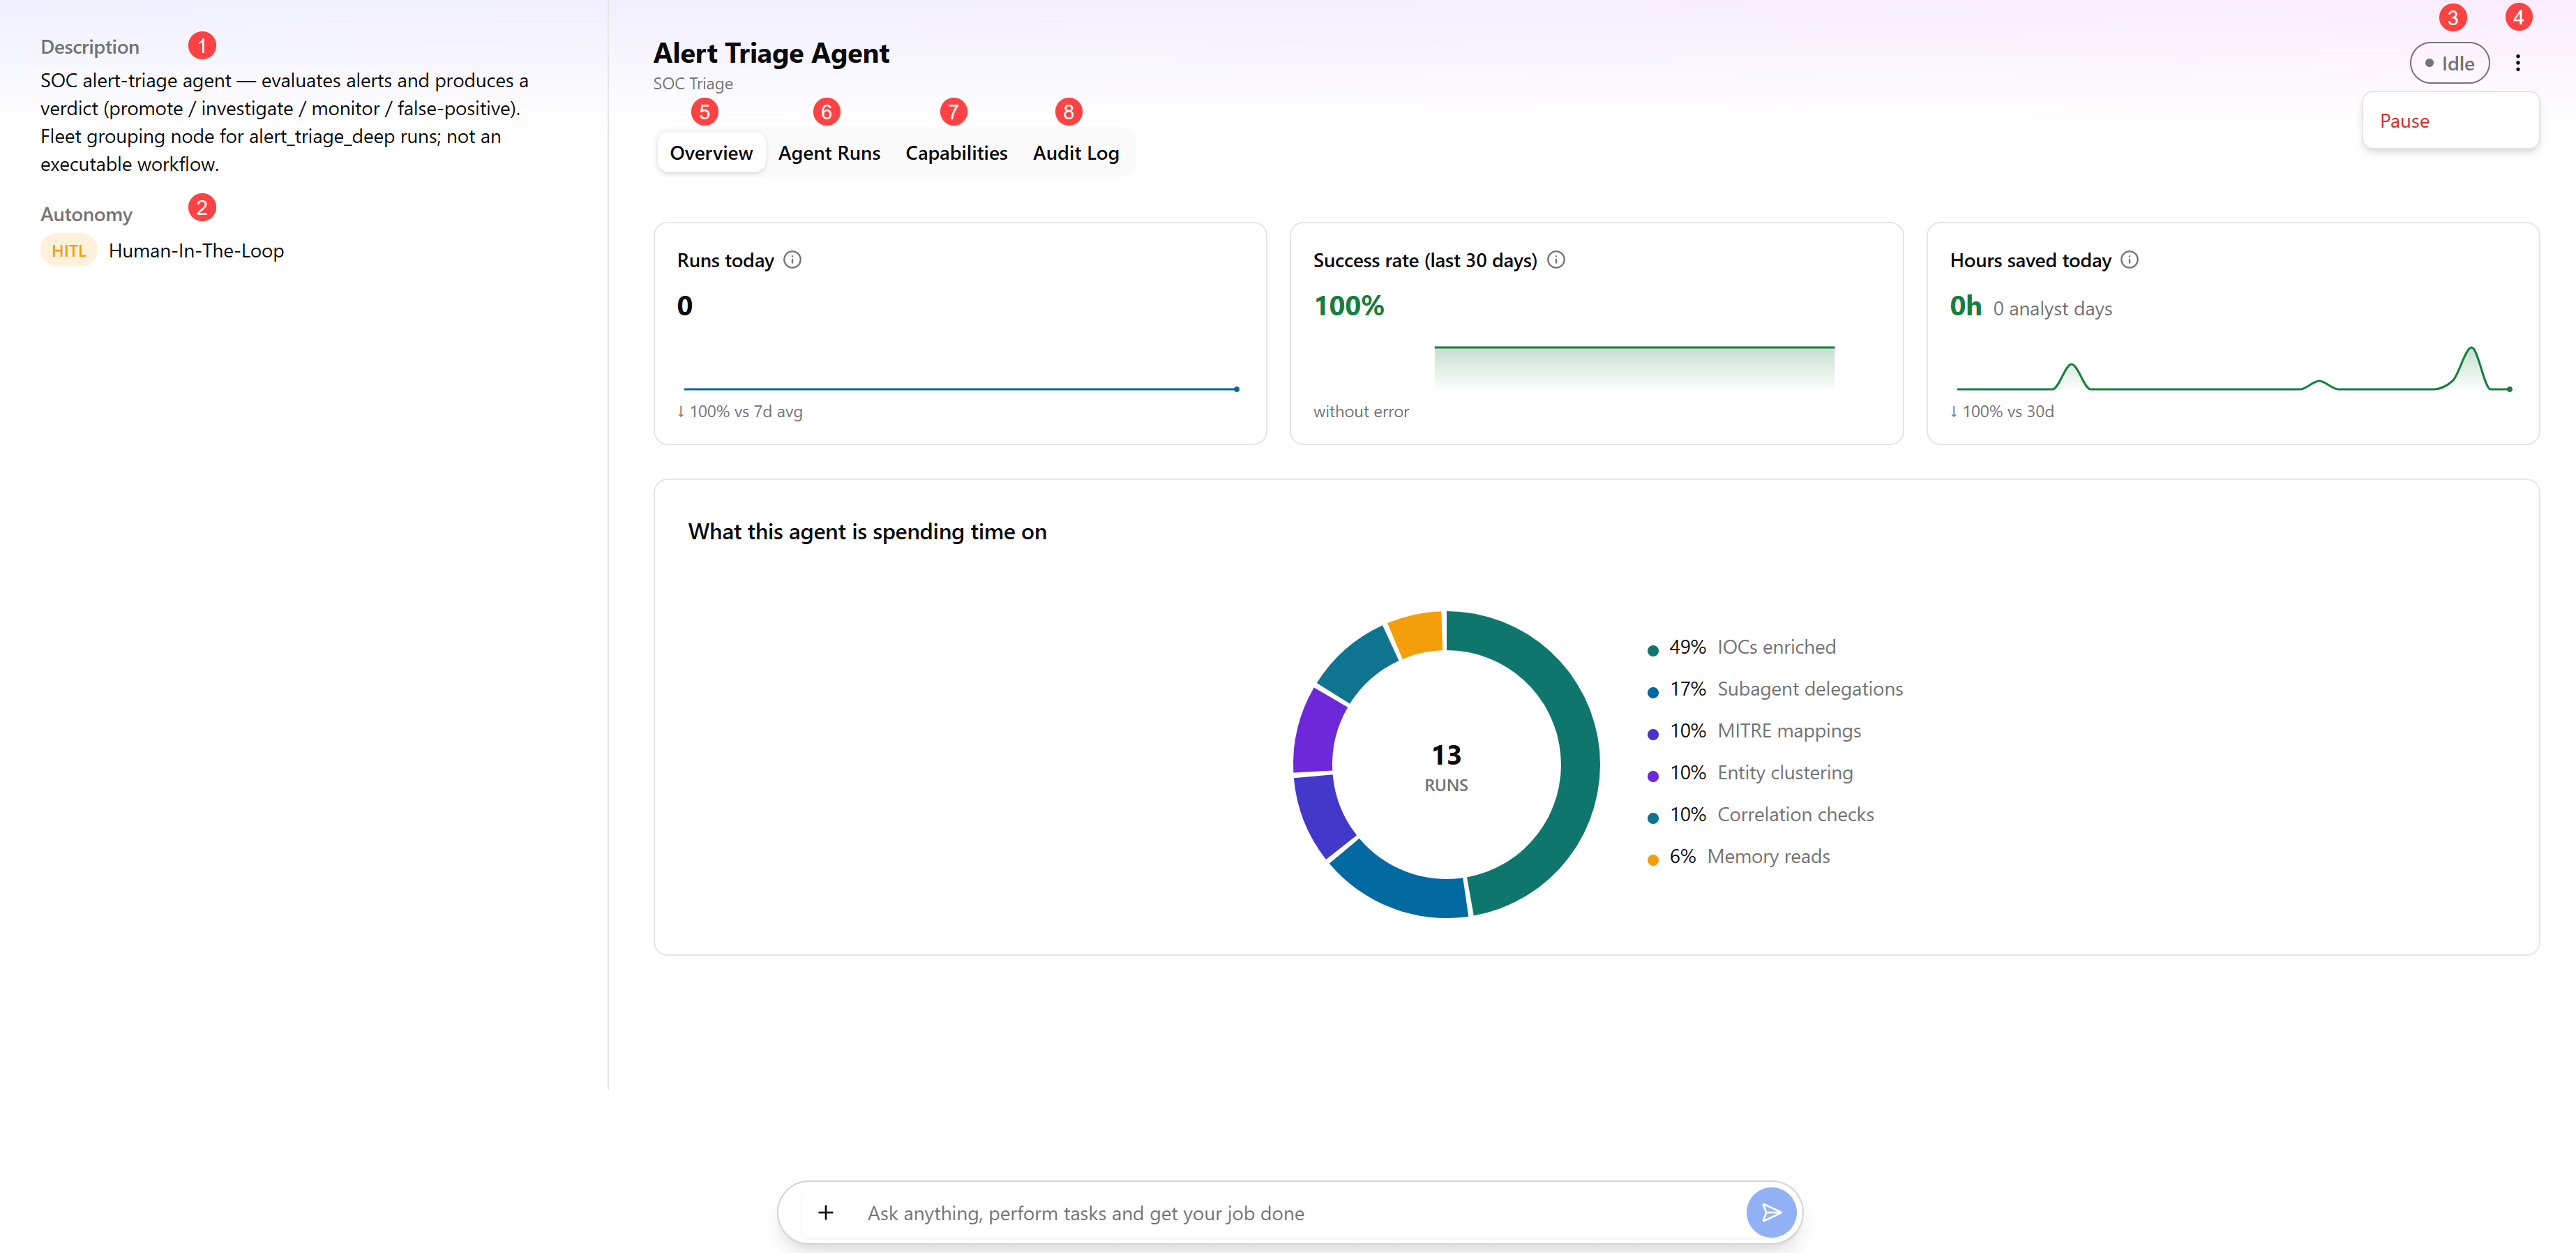
 Description: Description of the agent, its role and actions.
 Autonomy: Autonomy of the agent. Possible autonomy values include: HITL, HOOTL, and HOOTL.
 Status: Status of the agent. Possible status values include:
-
Running—agent is actively working — executing its current stage, calling tools, or processing evidence. This is the active, in-progress state for a triage or investigation run.
-
Idle—agent is available and waiting for new work. No alert, incident, or task currently requires its attention.
-
Paused—agent current run has been manually paused by an analyst. Progress up to this point is retained, and the agent will resume from the last completed stage rather than starting over.
-
Done—agent has completed its current run and produced a final result—a verdict, report, or recommendation. The output is available for review.
-
Error—agent encountered a problem it could not resolve on its own (for example, a tool timeout, an unavailable data source, or a failed validation) and could not complete its run. The issue is logged for review, and the run may need to be retried.
-
Disabled—agent has been turned off, either by an Organization Administrator or by configuration, and will not pick up or process any new work until it's re-enabled. Any items normally routed to it remain unclaimed and available for manual handling.
 Vertical more options menu: pause or enable the agent.
 Overview: See Overview for details.
 Agent Runs: See Agent Runs for details.
 Capabilities: See Capabilities for details.
 Audit Log: See Audit Log for details
Overview
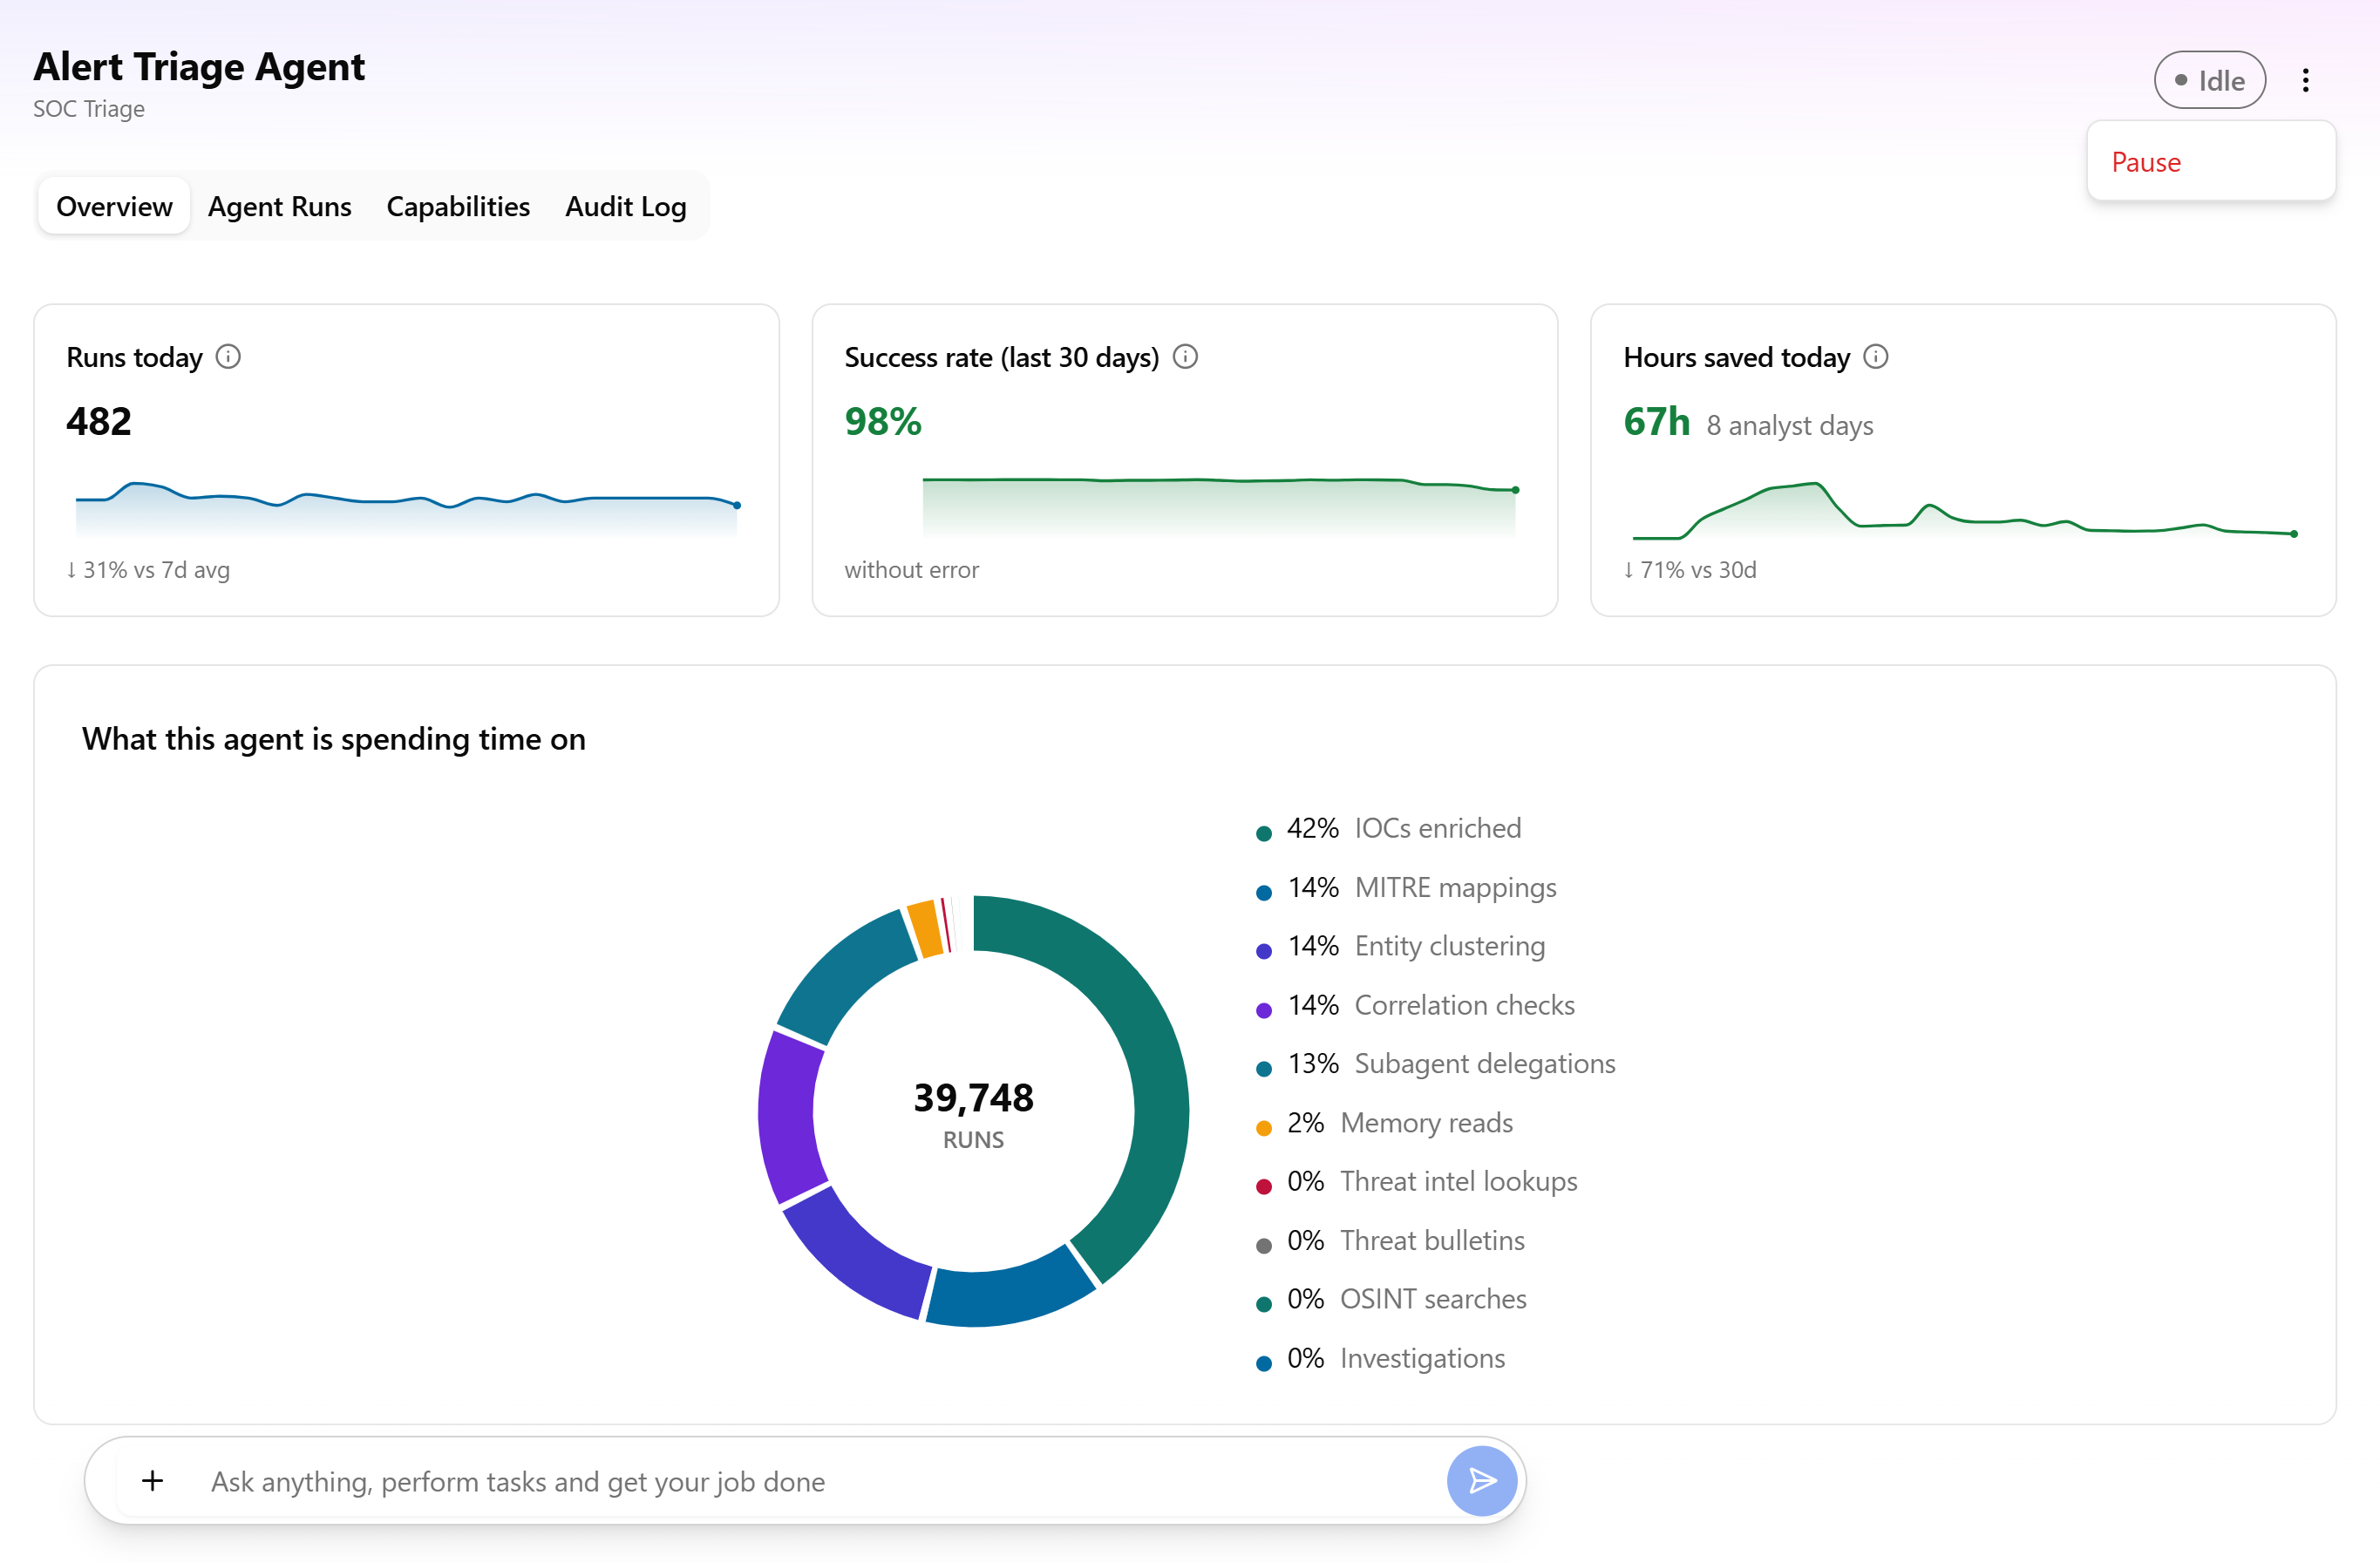
The Overview tab lets you assess performance of an agent at a glance.
It includes:
-
Key performance metrics, such as the number of runs, success rate, and hours saved
-
A breakdown of how the agent spends its time, such as on enrichment, sub-agent delegation, intelligence lookups, MITRE mapping, memory reads, and so on.
Below is an example of the Overview tab.
Agent Runs
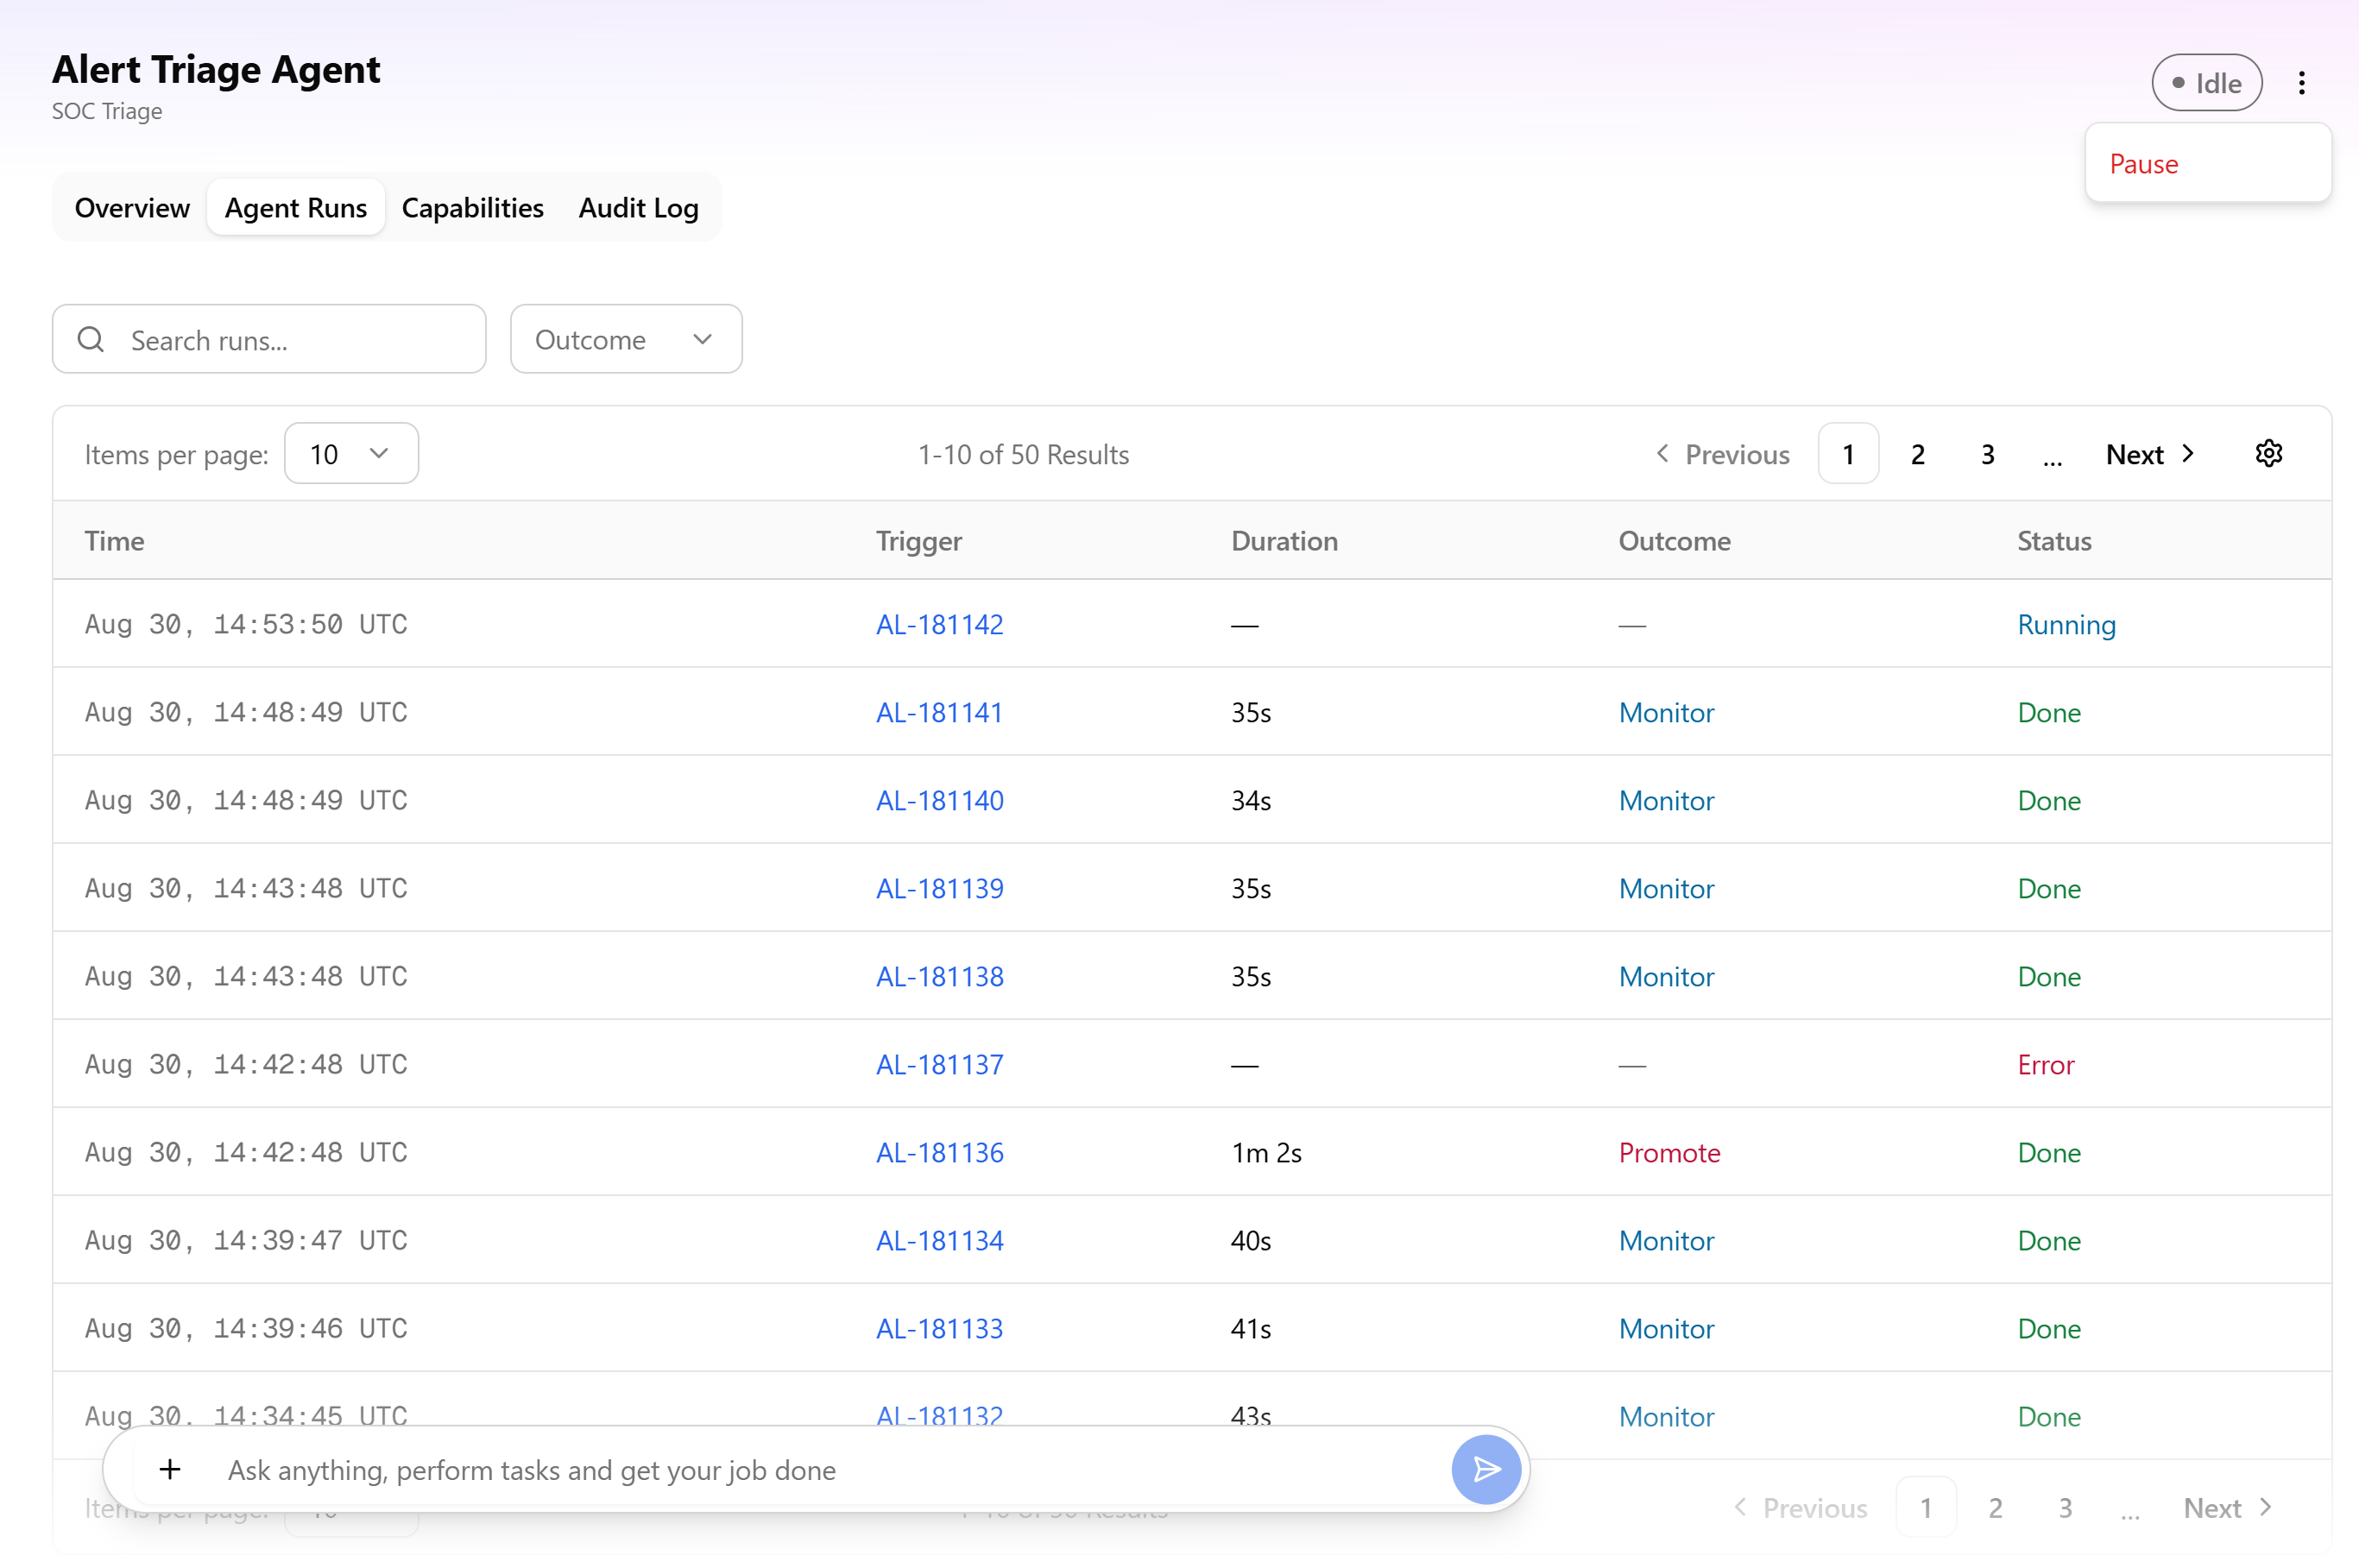
On the Agent Runs tab, you can search and page through every individual run for the selected agent. Each run is linked back to the event/action that triggered it and shows duration and outcome, giving you a per-execution record of what happened each time the agent ran.
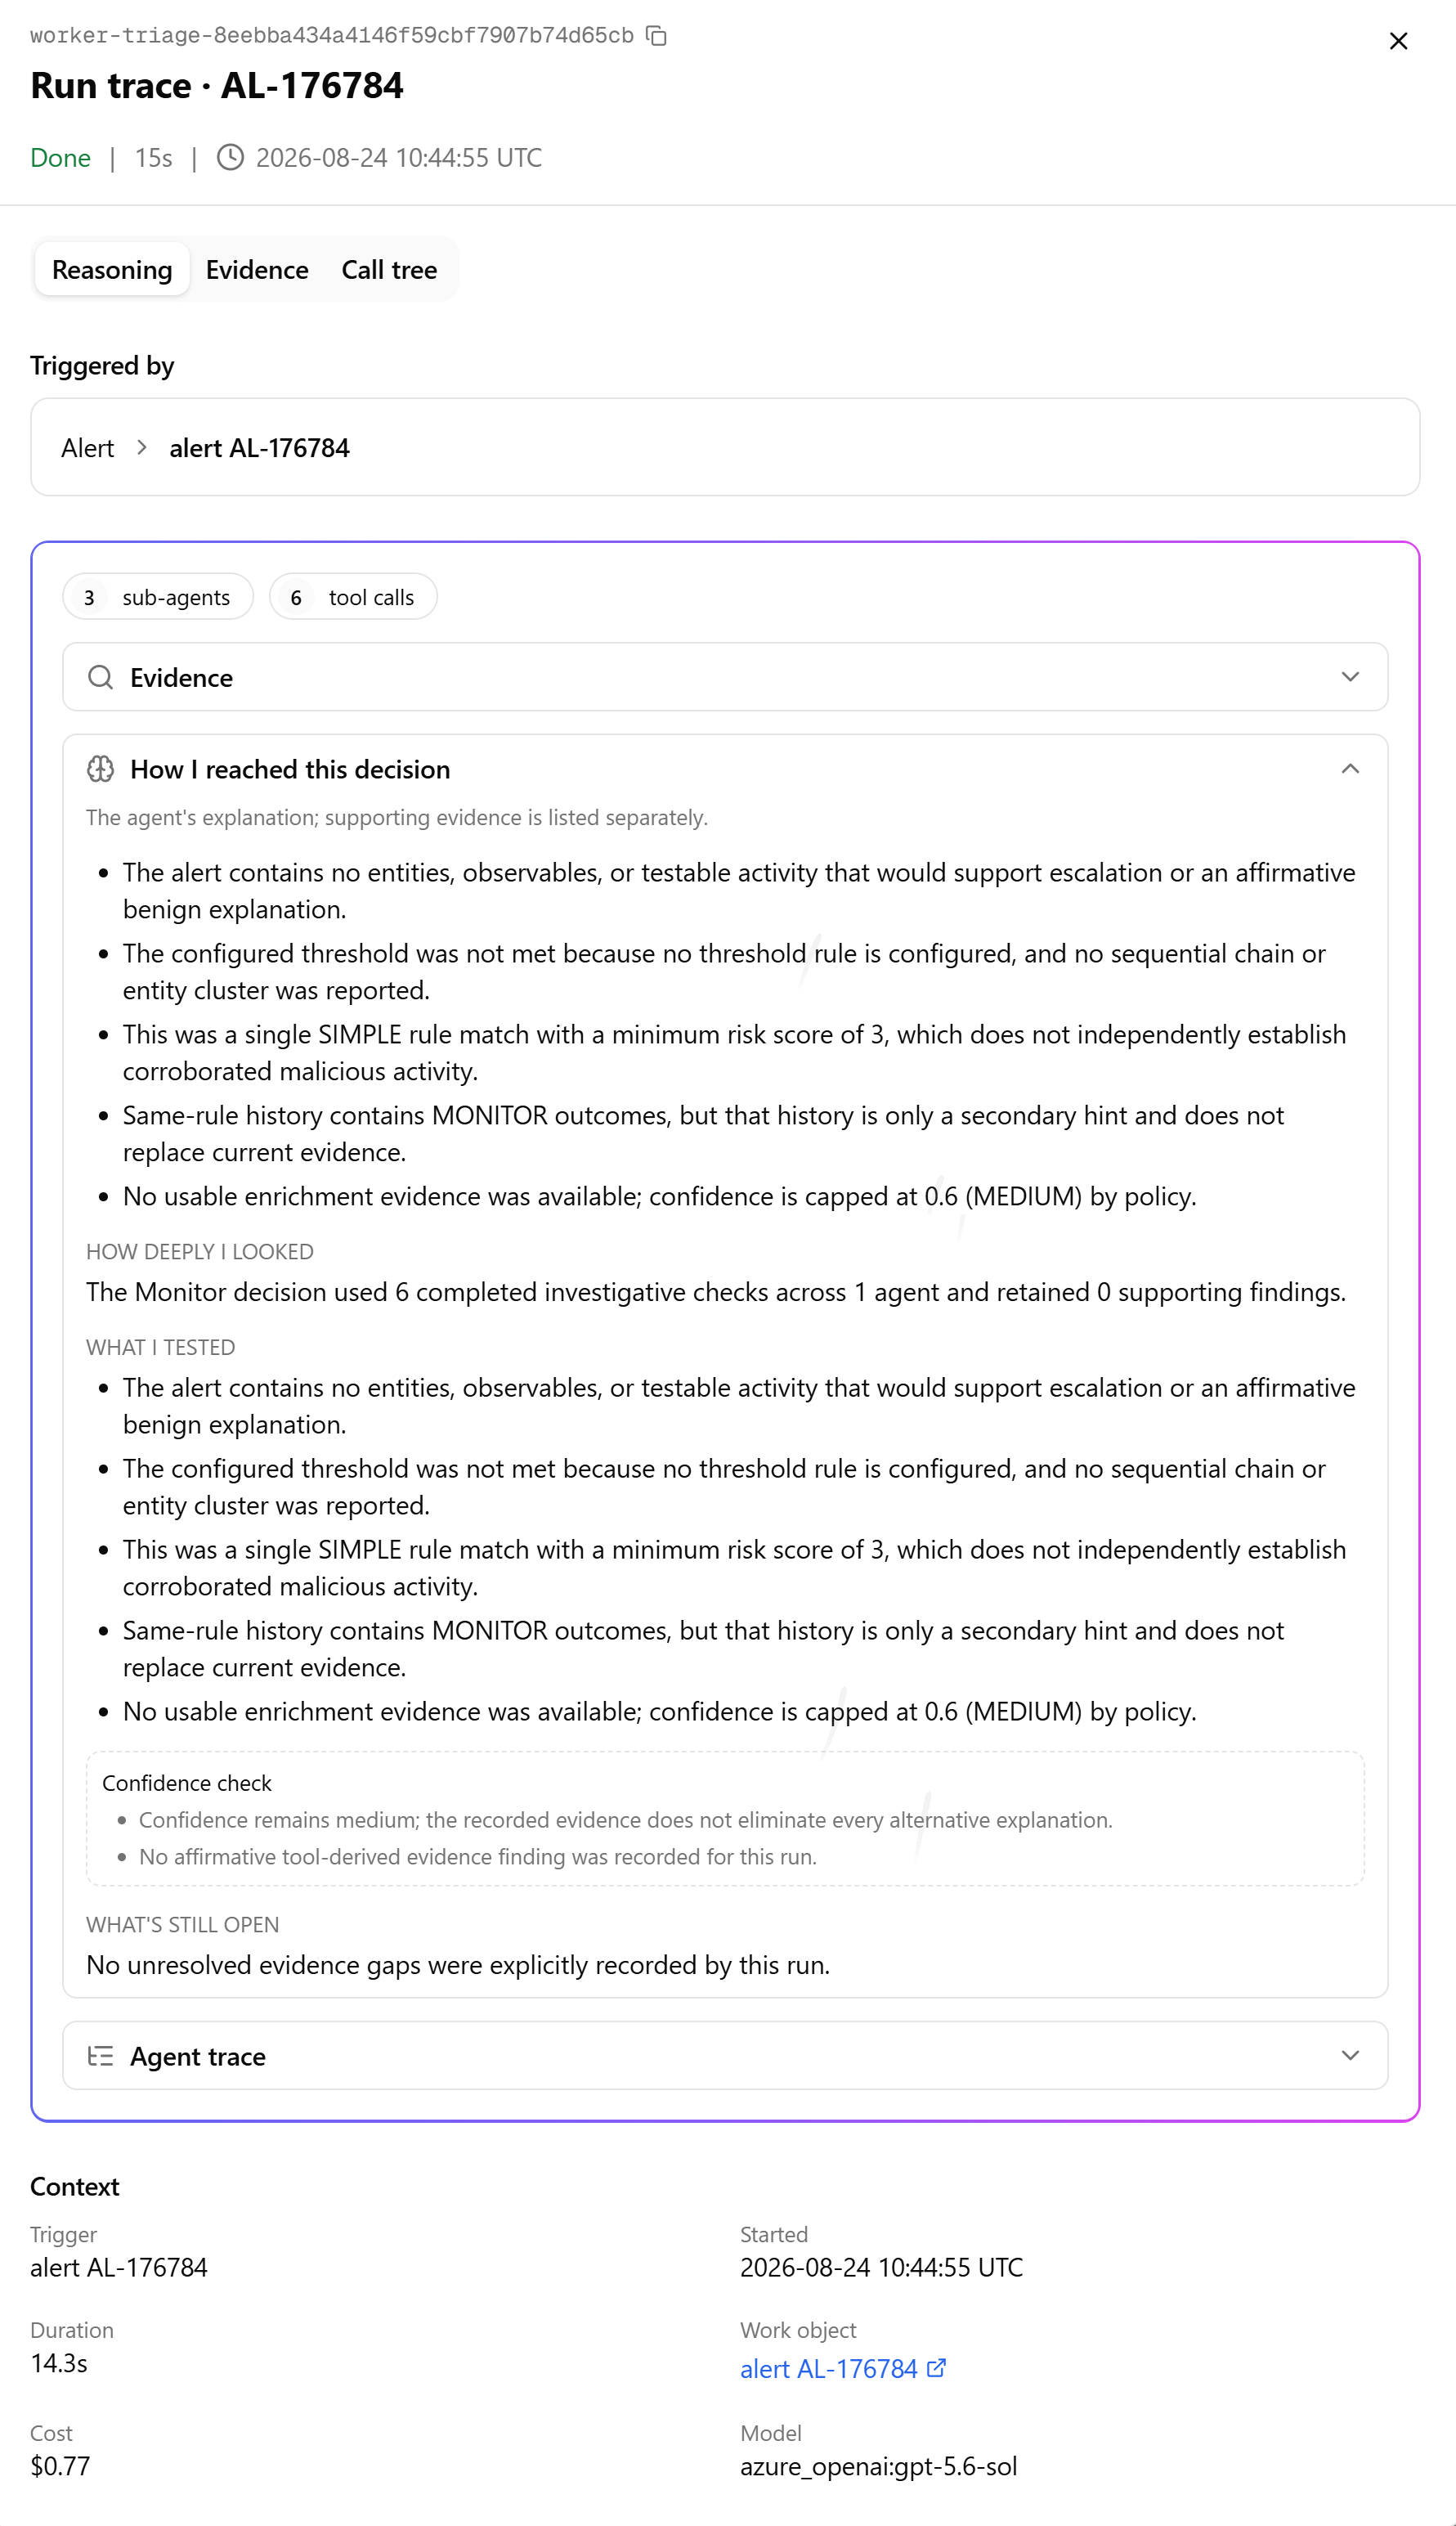
When you open the details of an agent run, you can review the trigger, execution status, reasoning, evidence, and execution trace to understand what initiated the run, what the agent evaluated, and how it reached its outcome. The run details also show the start time, duration, and other execution information, such as the model and cost.
Reasoning
The Reasoning tab shows how the agent reached its decision. You can review the agent's explanation, what it tested, the evidence it considered, confidence and any limitations or evidence gaps. The run can also show how many sub-agents or tool calls contributed to the evaluation.
The Triggered by sub-section identifies the event that started the run, such as an alert, detection, case, or human request. For an alert-triggered run, you can open the associated alert to review the source event and its context. The agent uses the triggering event, retrieved data, intermediate reasoning, and tool results as the task context for the run.
The Evidence sub-section provides the evidence the agent considered such as log sources, detection rules and alerts, how deeply it looked into it, confidence check, what it tested, and whether it identified any limitations or evidence gaps.
The Agent Trace sub-section shows the sub-agents that contributed to a run and what each one found. Each sub-agent card gives a plain-language summary of its role and its conclusion, so you can follow how the run's outcome was built up, sub-agent by sub-agent, without needing to dig into raw tool calls.
The Context section provides additional execution details, including the triggering object, start time, duration, associated work object, model, and cost.
Evidence
The Evidence tab lets you review the supporting evidence used during the run. Depending on the workflow, this can include the triggering rule and matched activity, involved users, hosts, or applications, threat intelligence, enrichment results, related alerts and correlation patterns, organizational context, relevant history, and targeted security-telemetry searches.
For investigation workflows, evidence can also include query results and their contribution to the investigation, such as evidence that supports, contradicts, or is unrelated to the hypothesis. Missing or unavailable evidence is identified rather than treated as evidence, and confidence is adjusted when important data is unavailable.
Call Tree
The Call Tree tab gives a more technical view of a run execution, showing the tool calls made and the data they returned. Use it when you need to trace exactly what happened at the tool-call level, such as confirming which query or tool produced a particular result.
(Click the image to enlarge it.)
Capabilities
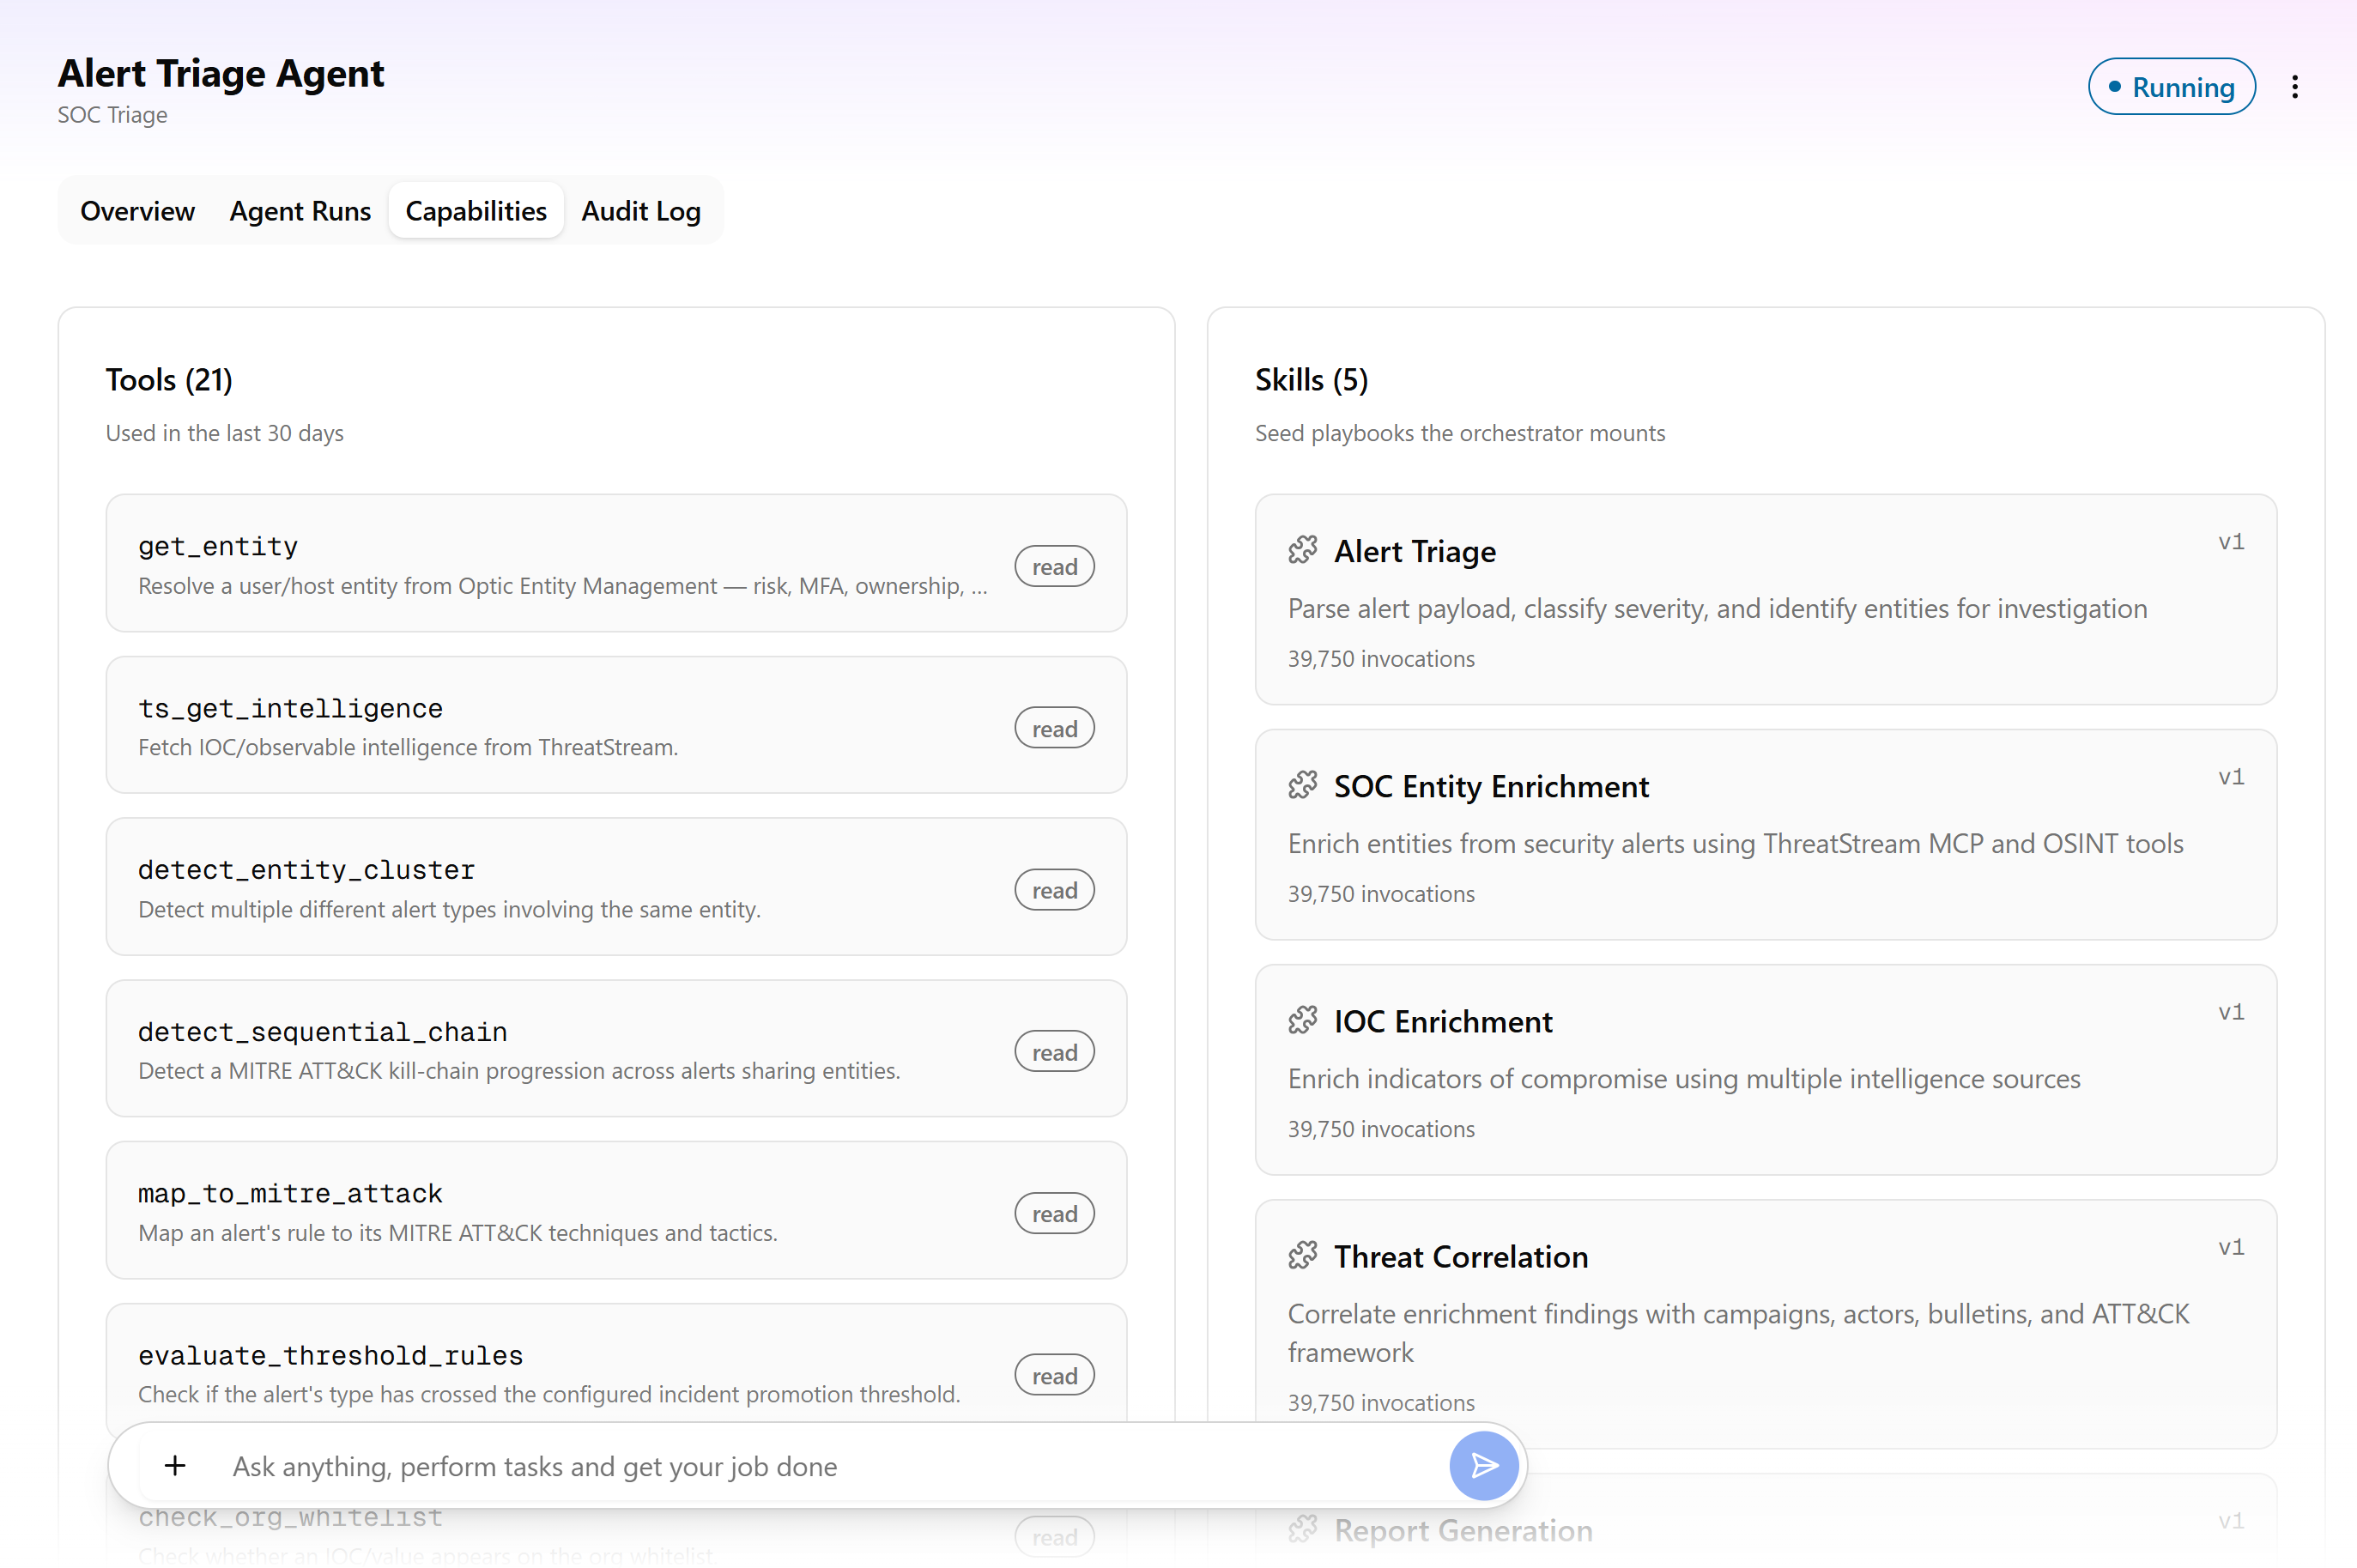
The Capabilities tab shows the tools, skills, and sub-agents available to the selected agent. What you see here reflects your own permissions as well as the agent configuration. A tool the agent could use does not appear if you do not have permission to invoke it. If you only have partial access, the Capabilities tab indicates which capabilities are unavailable to you and what permission would be required to see them.
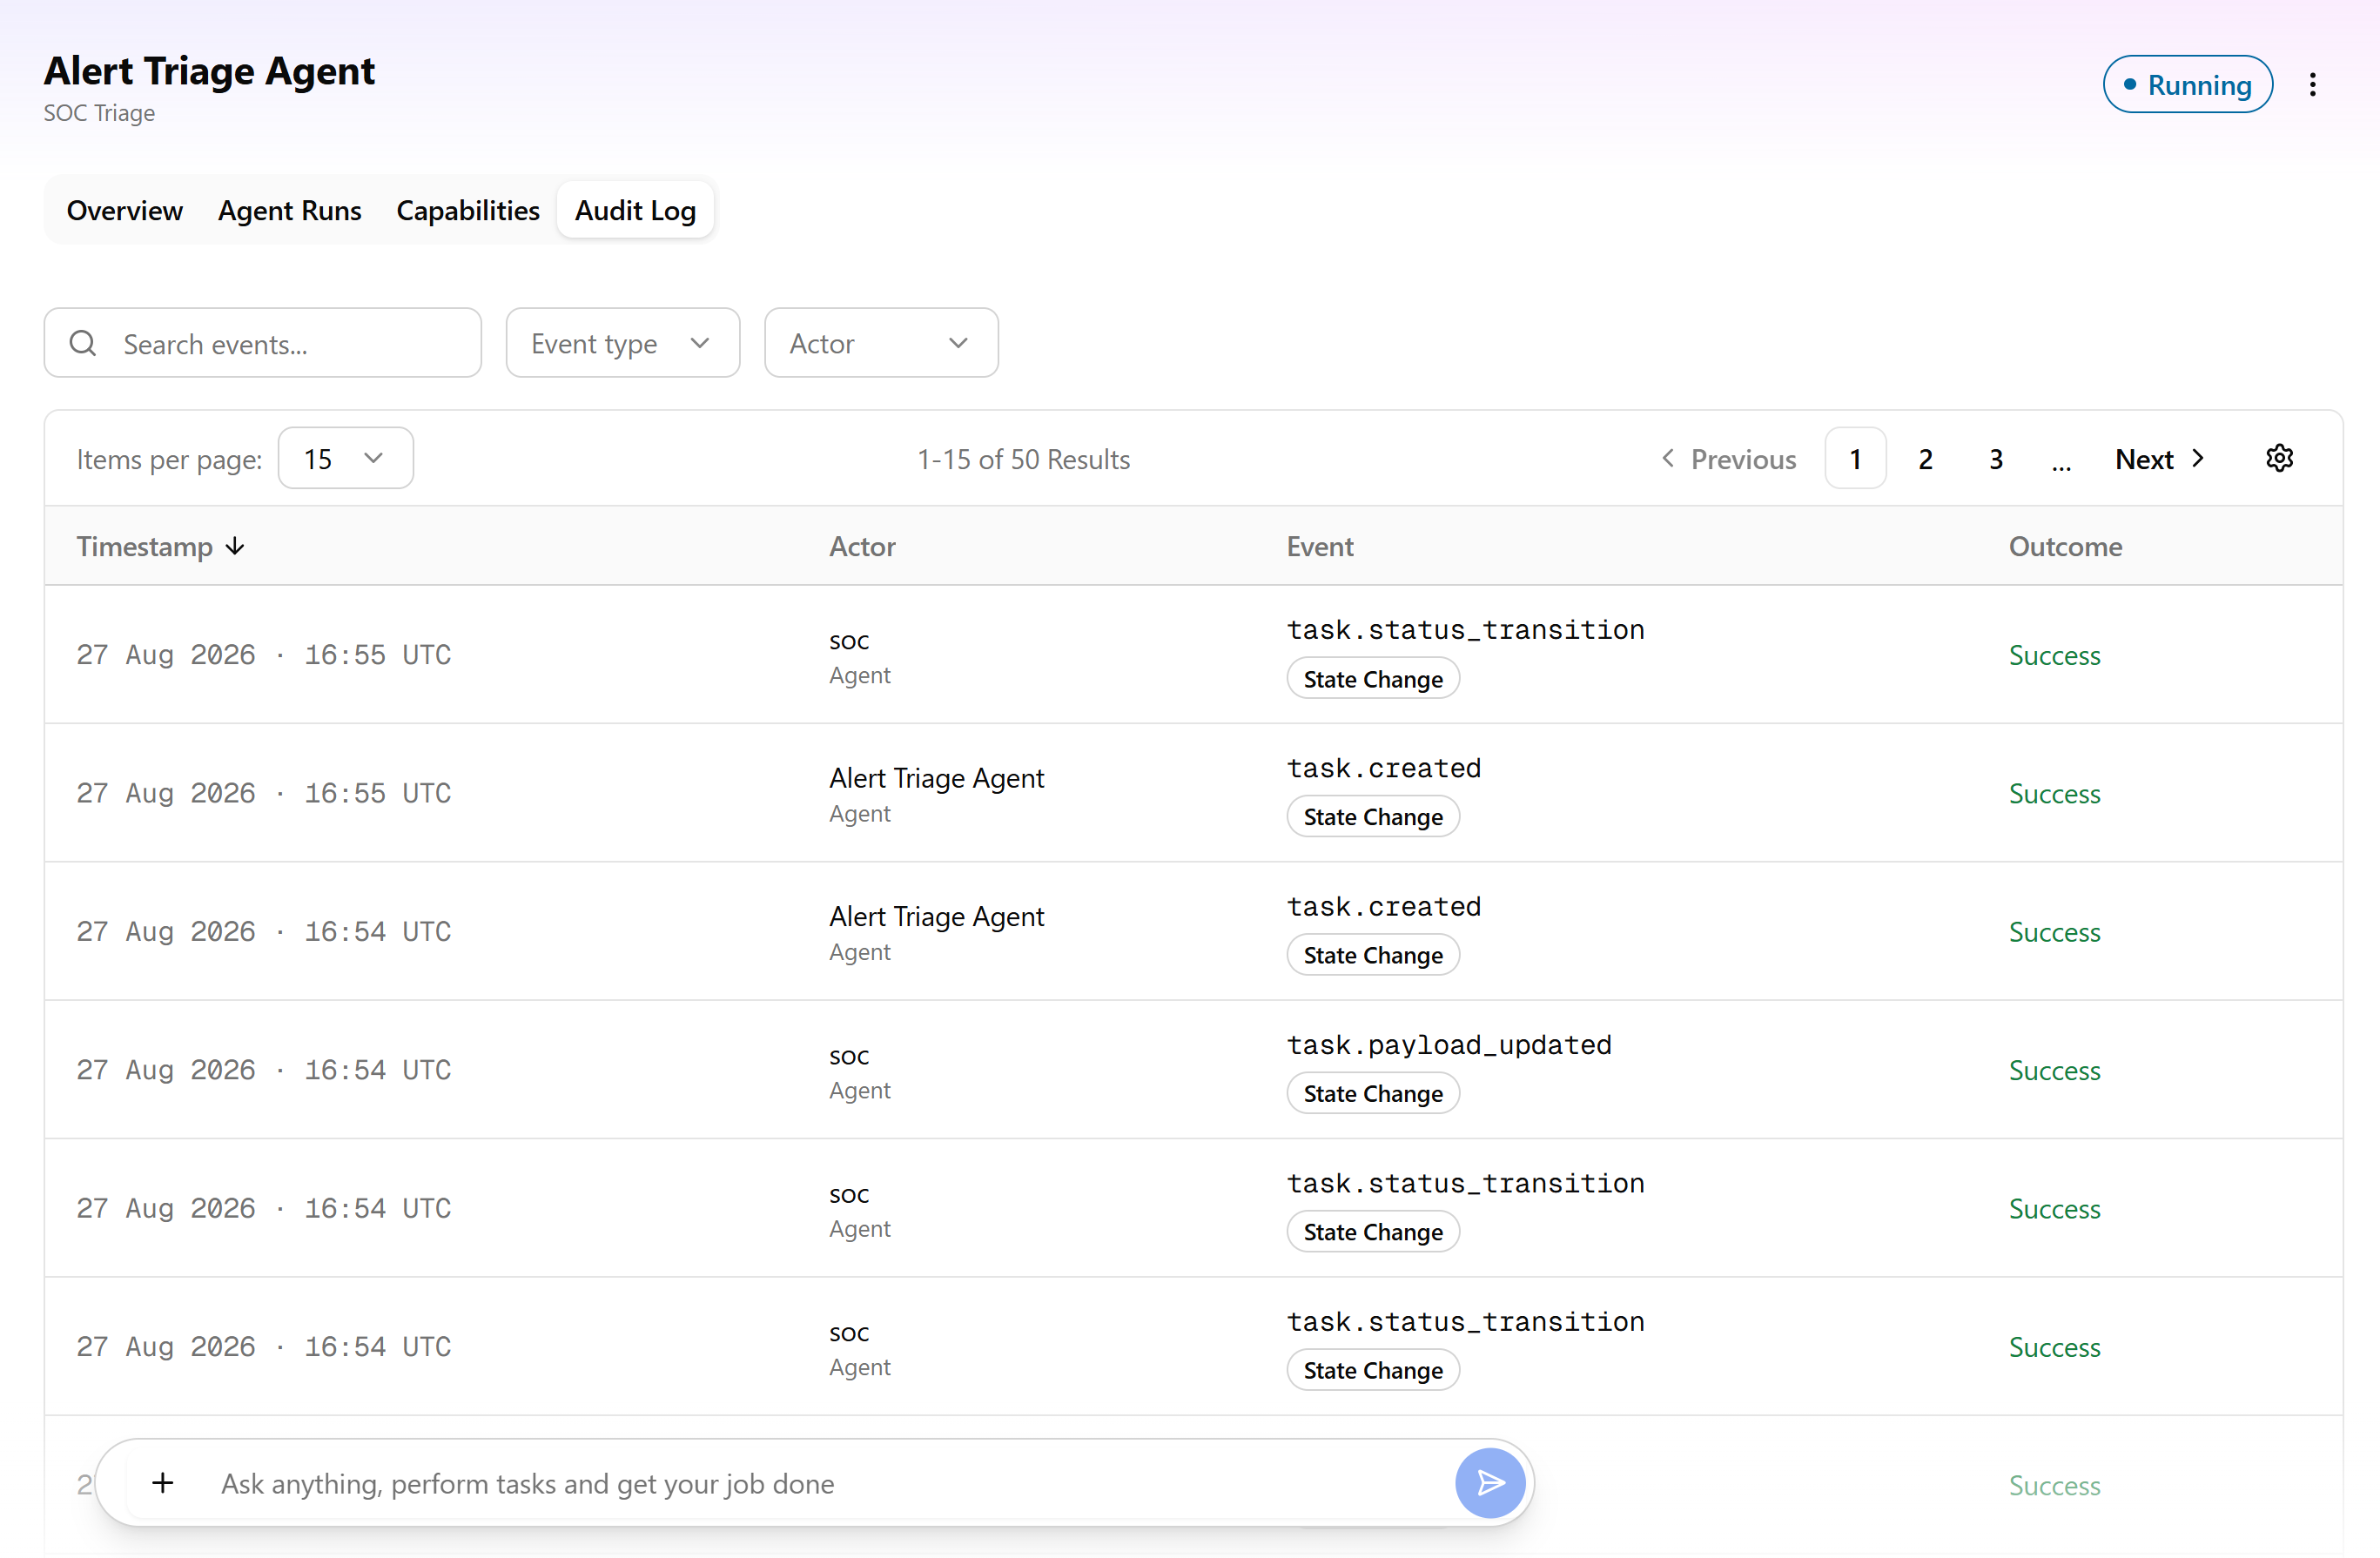
Audit Log
On the Audit Log tab, you can search and filter the activity of an agent to trace what happened throughout its lifecycle. The audit log records agent actions, system events, and human decisions, including state changes, escalations, approvals or rejections, handoffs, and errors. Each event includes details such as the timestamp, Actor, Actor type, and outcome to help you distinguish actions performed by the agent, the system, or a human user.
The audit log provides an immutable record of agent activity that you can use to understand how an outcome was reached, investigate errors or unexpected behavior, and reconstruct the sequence of events for compliance or forensic review. Failed steps are also recorded with information about the error, the tool involved, retry attempts, and any recovery action taken.
Use the Audit Log tab when you need to answer questions such as what happened, when did it happen, who or what performed the action, and how did the workflow reach its current state?