
Command Center: Global Threat Landscape
The Global Threat Landscape dashboard (also referred to as Command Center) is designed to replace the traditional data-heavy home view with a more focused, Anomali AI-driven experience that surfaces relevant, timely, and actionable intelligence as soon as you log in. Serving as your starting point for understanding the current threat landscape, Command Center eliminates the need to piece together information across multiple tools by providing a single, centralized dashboard. It brings together the most important intelligence for your organization—such as active attacker operations, trending malware and vulnerabilities, targeted entities, and curated global news—so you can immediately see what matters most.
Once on the dashboard, you can interact with any widget object to quickly orient yourself and take action. Clicking an object opens a concise Anomali AI-generated summary, giving you an at-a-glance understanding of the threat or event. From there, you can dive deeper by opening the object in the threat model advanced search page to explore the underlying source data. When you need to document or share your findings, you can copy a summary to the clipboard or export an object to PDF in just a few clicks.
By consolidating key insights and putting these actions upfront, Command Center helps you prioritize your work and move from awareness to action with greater speed and clarity.
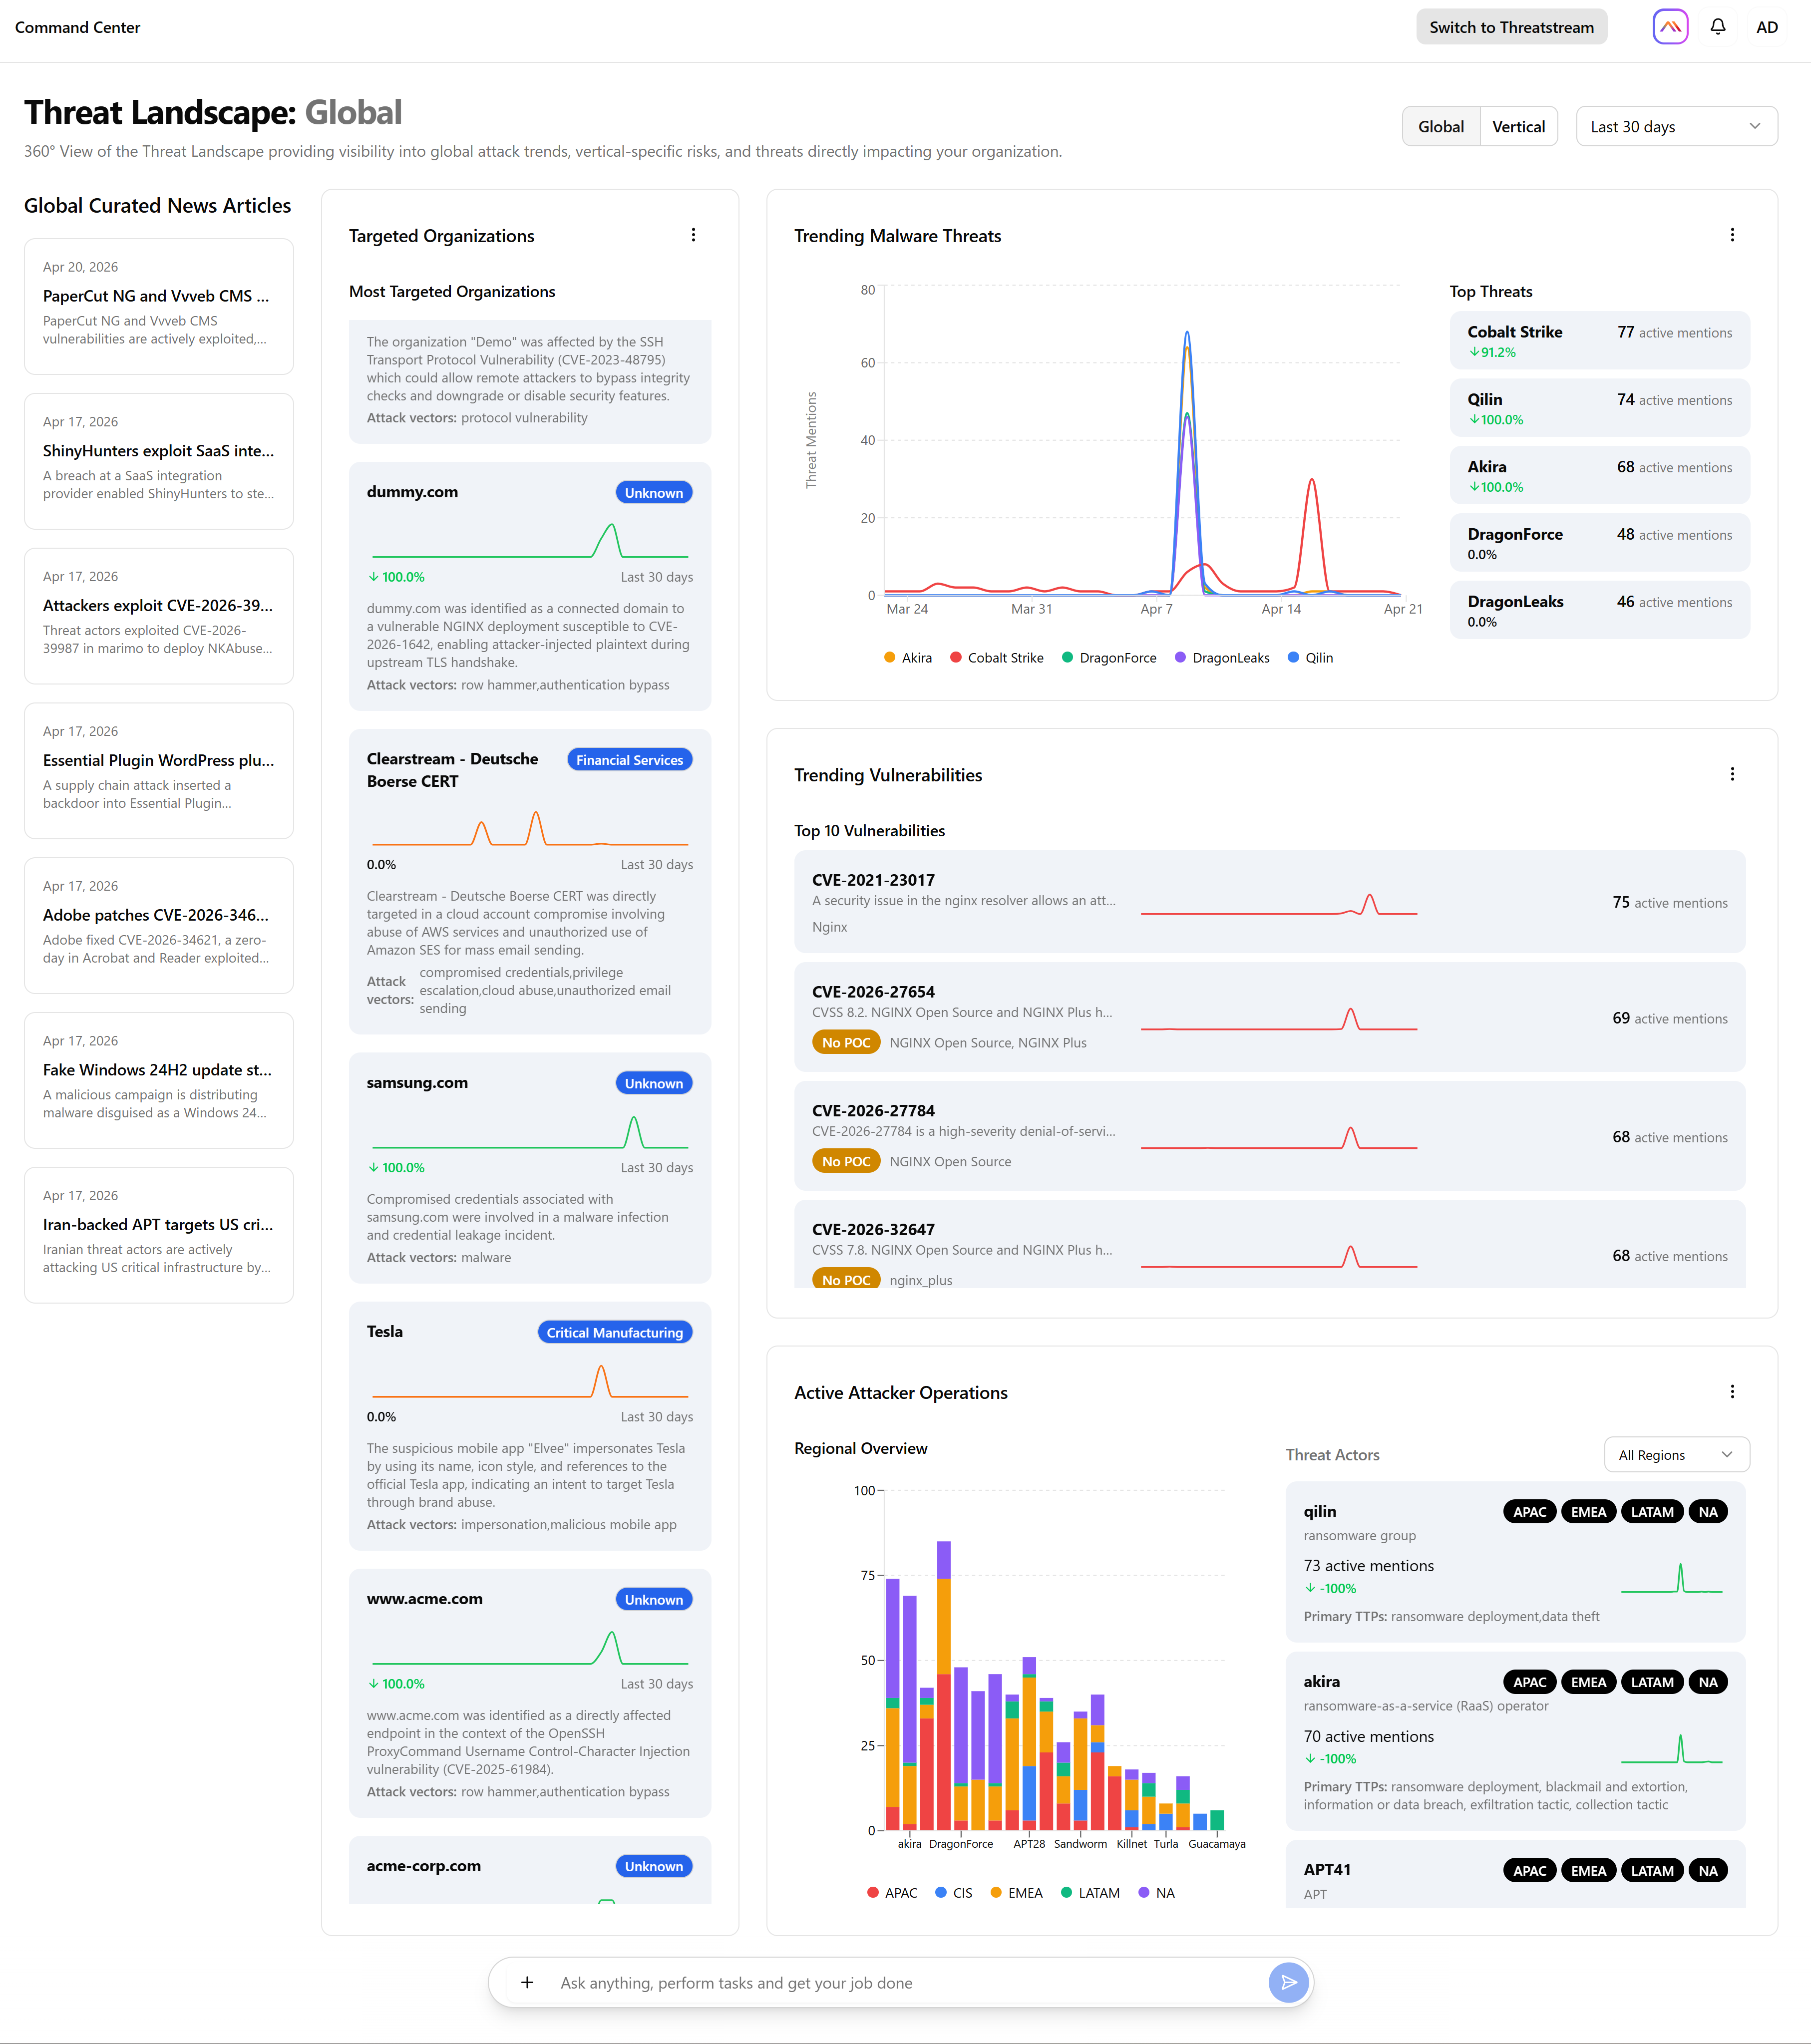
Data Generation and Dashboard Architecture
All dashboard content is generated through curated queries and processed in a nightly batch job, with the results cached to ensure fast page loading. The data presented is based on open-source intelligence and does not include any customer-private information.
The Global Threat Landscape dashboard offers two views:
-
Global: displays global widget data based on open-source intelligence available for Anomali.
-
Vertical: displays details specific to the industry selected from the drop-down list.
The Vertical list includes the following industries, which are aligned with the STIX 2.1 and CISA critical infrastructure sector vocabularies.-
Aerospace
-
Automotive
-
Chemical
-
Commercial
-
Construction
-
Dams
-
Defense
-
Education
-
Emergency Services
-
Energy
-
Entertainment
-
Finance
-
Food
-
Government
-
Healthcare
-
Hospitality-Leisure
-
Insurance
-
Legal
-
Manufacturing
-
Nuclear
-
Retail
-
Technology
-
Telecommunications
-
Transportation
-
Utilities
-
Water
-
Dashboard Actions
On the Global Threat Landscape dashboard, you can quickly understand what’s happening by viewing concise summaries of widget objects. If you need to share or document your findings, you can export widget data as a PDF or copy the widget summary for use elsewhere. When a summary isn’t enough, you can dive deeper by navigating to dashboard object sources on the threat model advanced search page and exploring the data deeper.
-
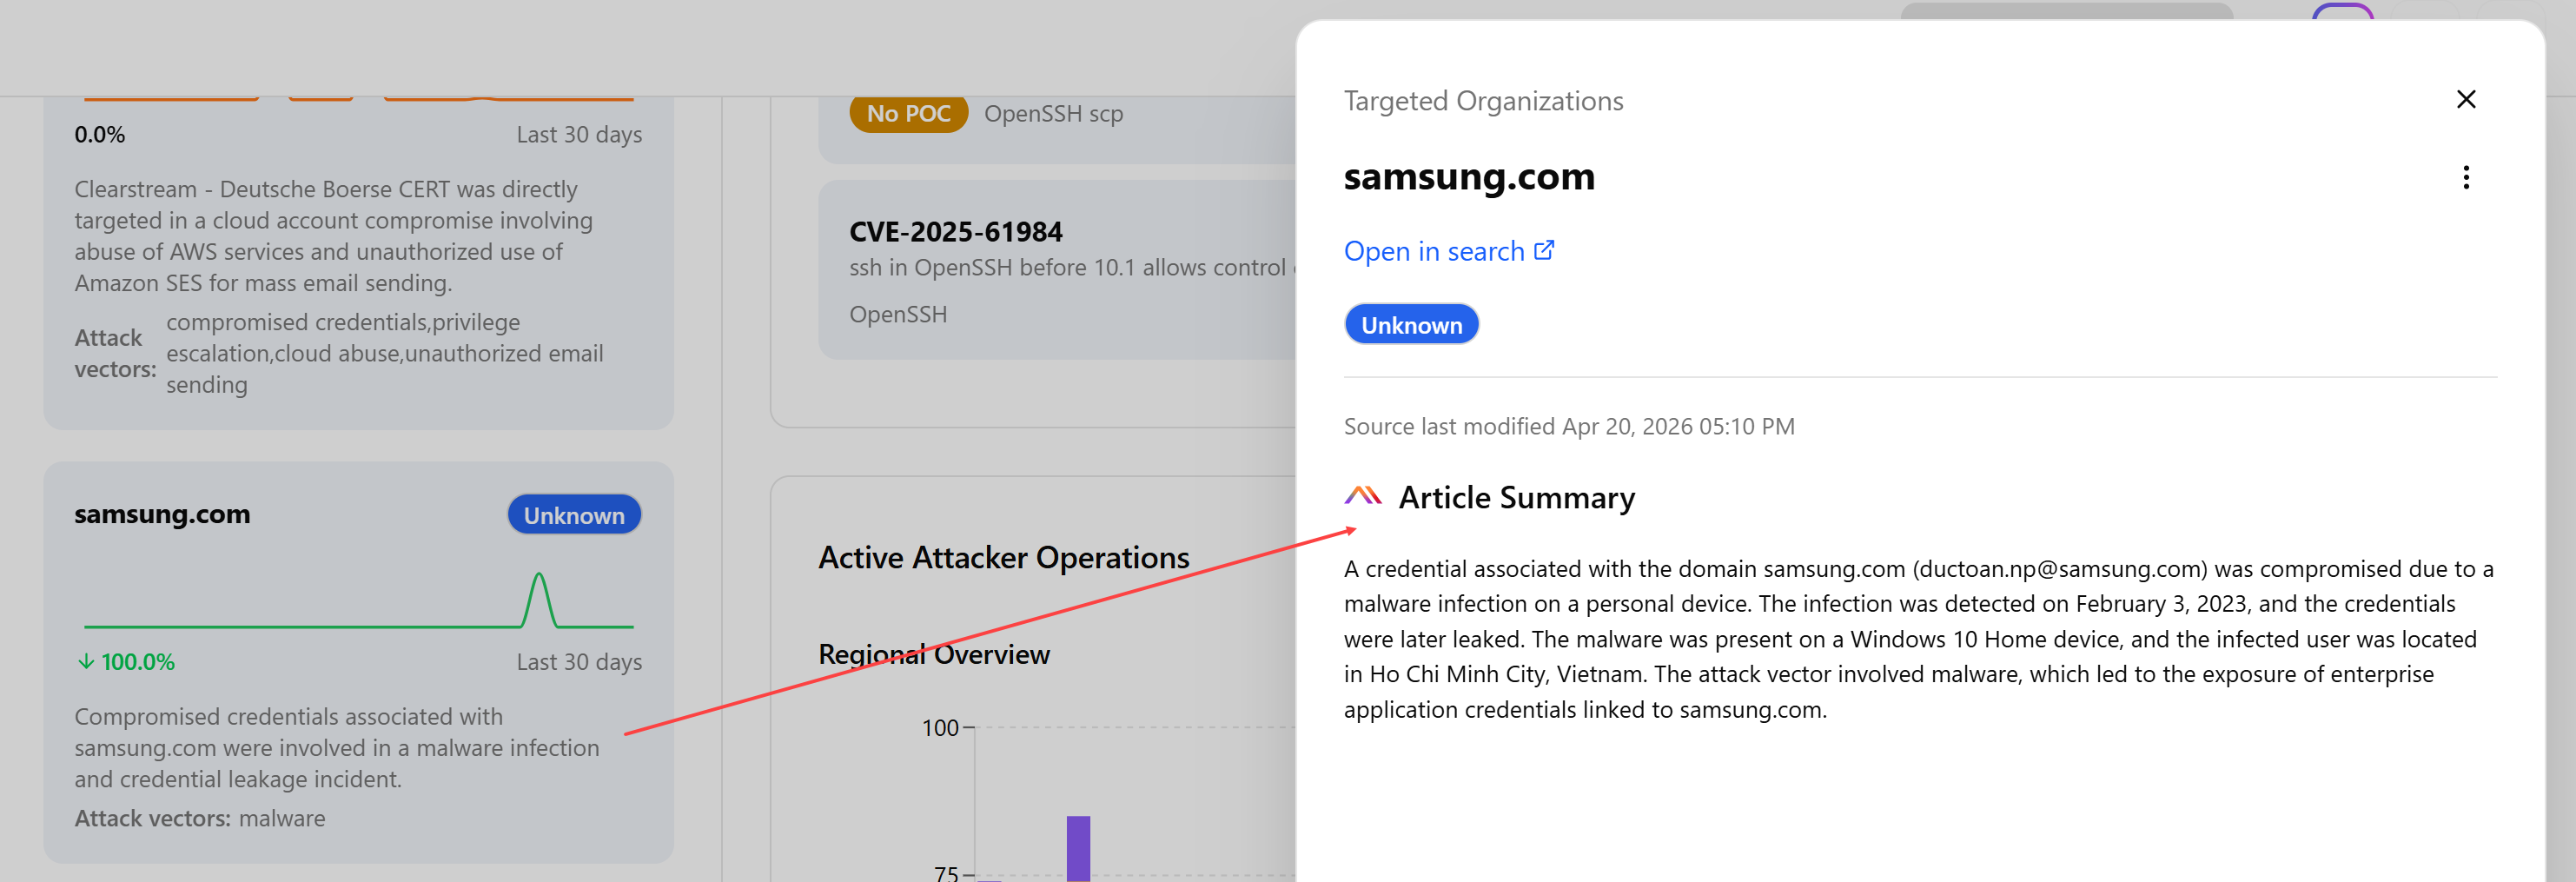
To view a dashboard object summary, click the object of your interest. The summary window opens.
-
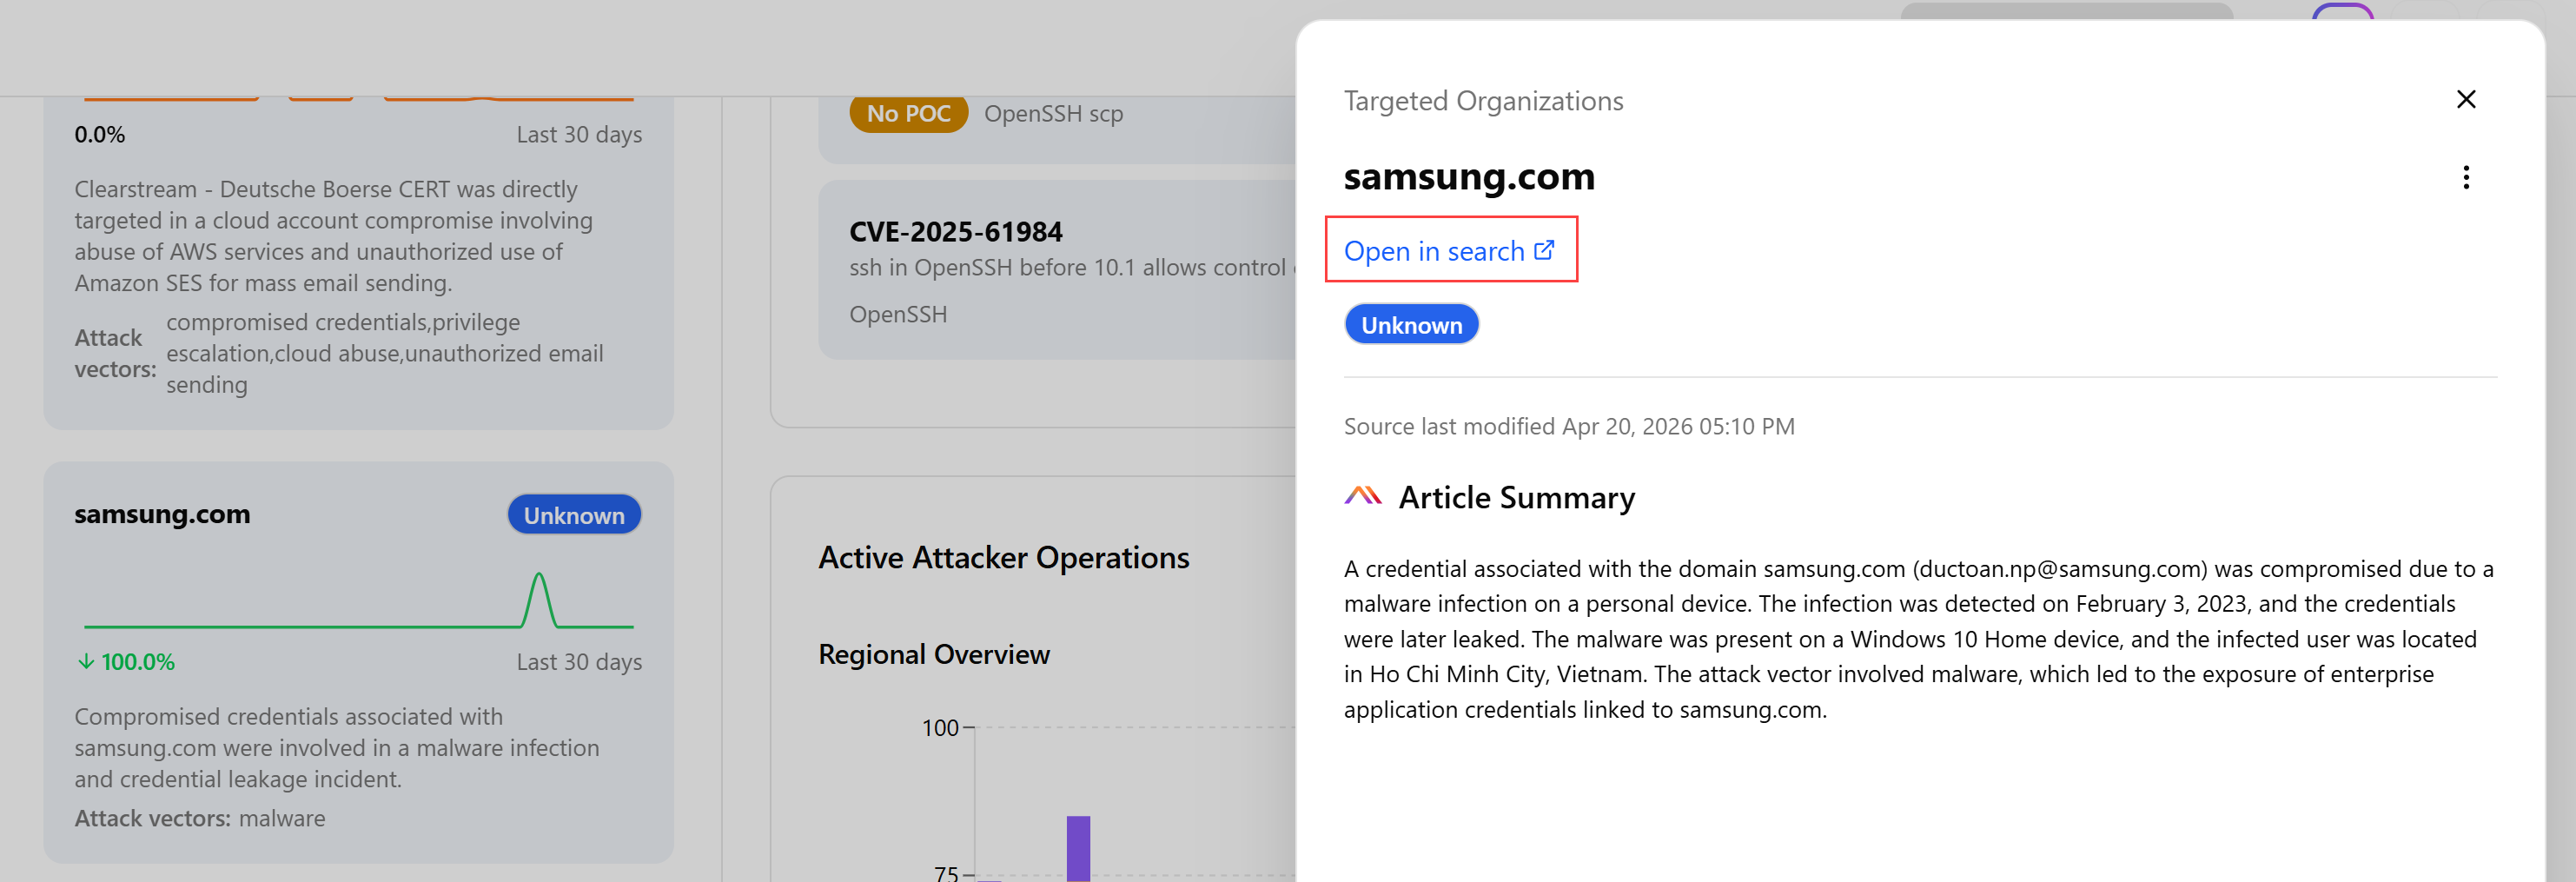
To view sources of a dashboard object, click the object of your interest and then click Open in search. You are redirected to the threat model advanced search query page where you can view all threat models that served as a source for creating the dashboard object.
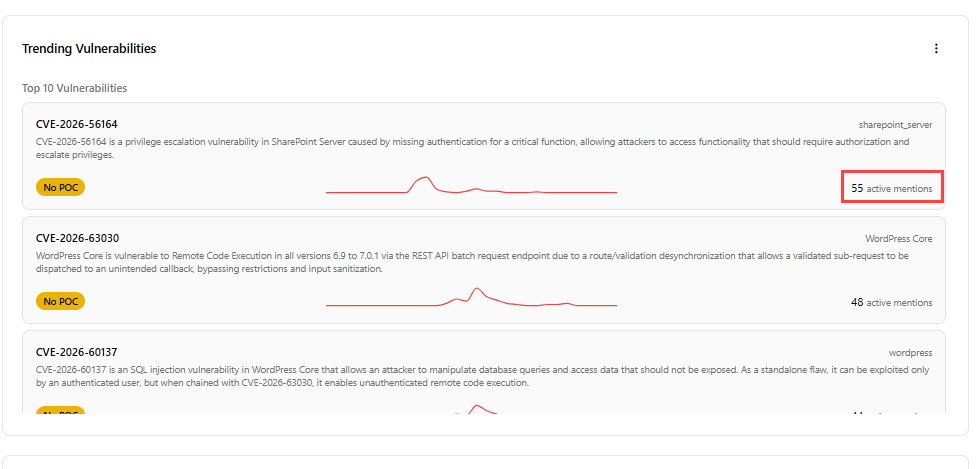
The Trending Vulnerabilities widget also includes the number of active mentions, which represents the total number of threat intelligence entities—such as Threat Bulletins, Malware entities, Vulnerabilities, and Actor records—that reference the vulnerability by name, alias, tag, or within their content during the selected 7-, 30-, or 90-day period. The total number of mentions is the sum of the daily trend counts.
-
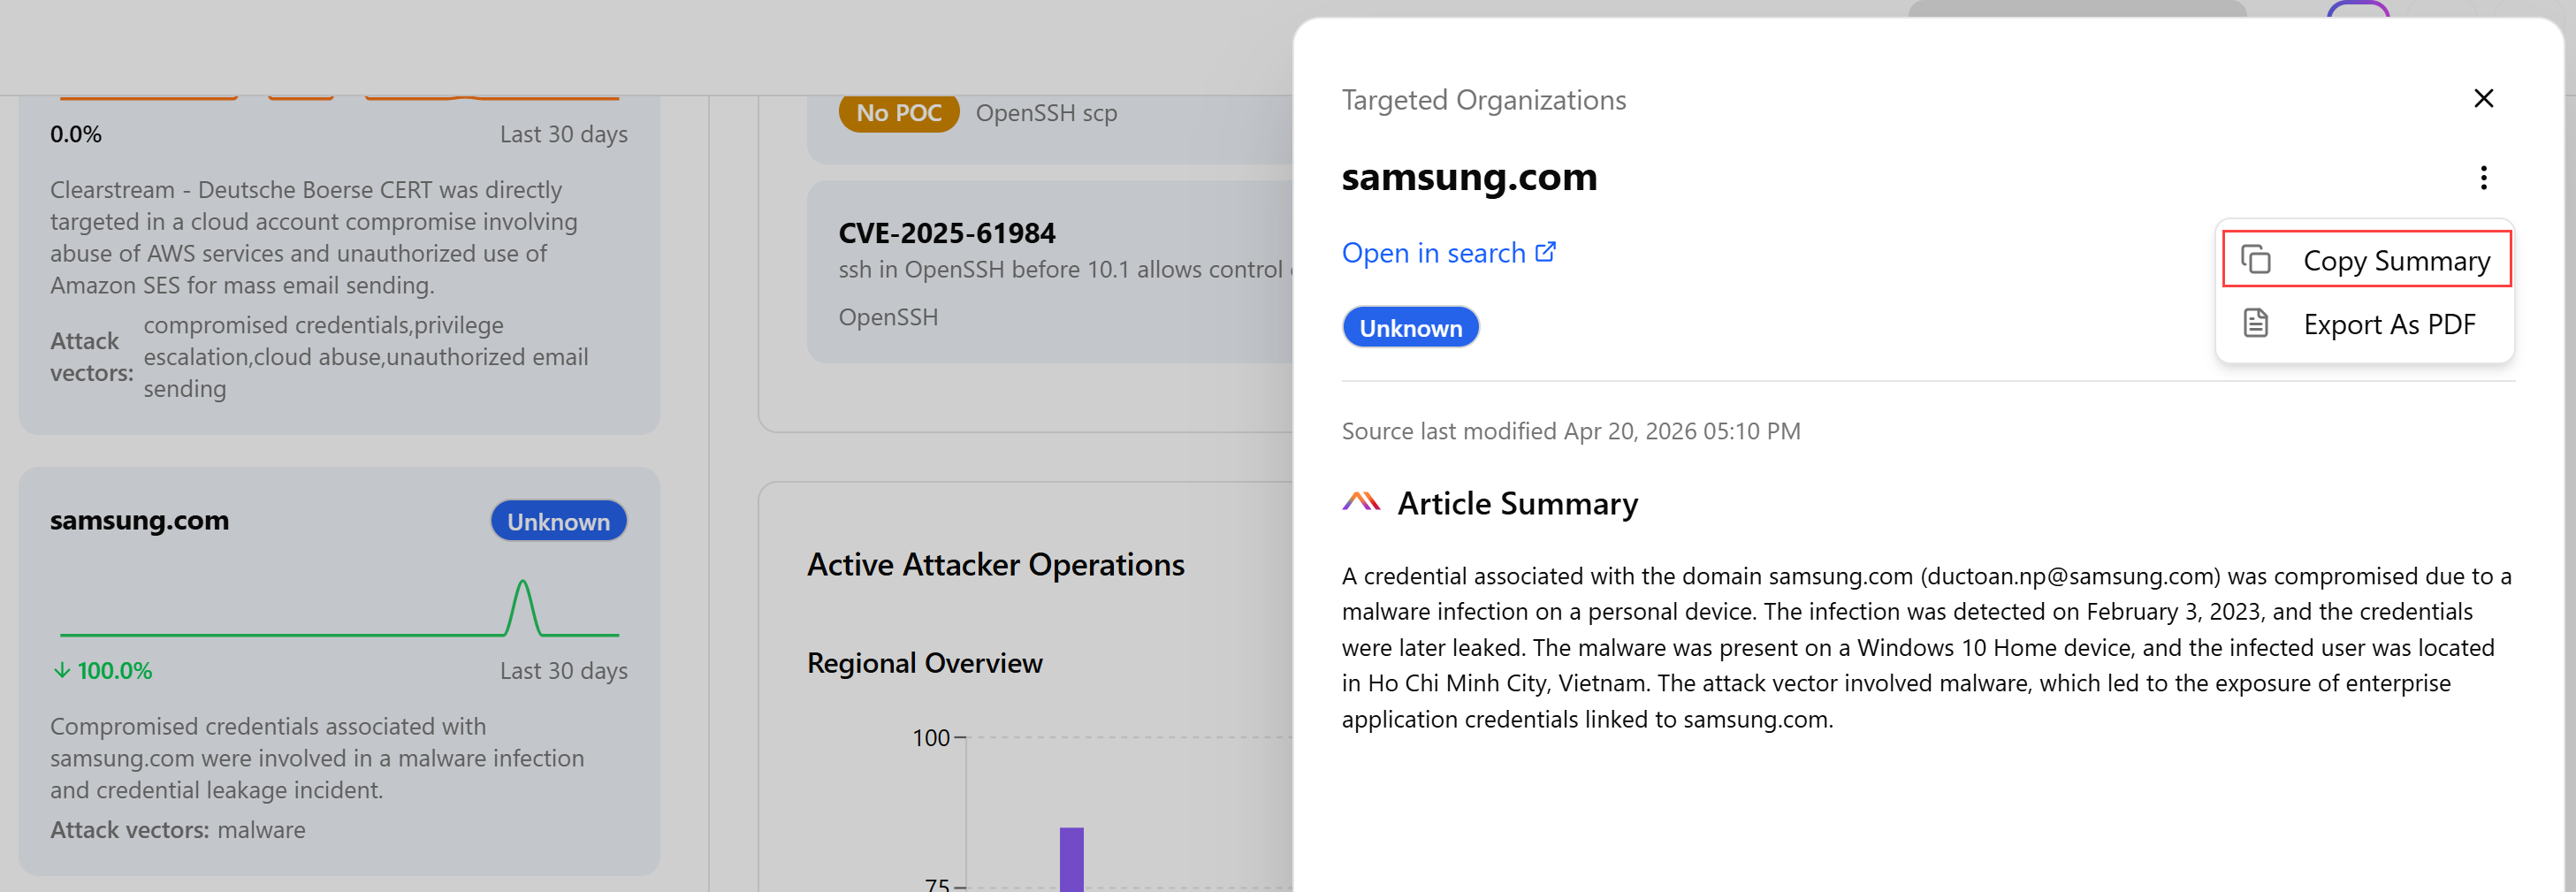
To copy a summary of a dashboard object:
-
Click the object of your interest.
-
In the summary window, click the more options menu (...).
-
Select Copy Summary.
The summary is copied to the clipboard. You can paste it anywhere you need.
-
-
To export a dashboard object to PDF:
-
Click the object of your interest.
-
In the summary window, click the more options menu (...).
-
Click Export As PDF.
The download process starts immediately.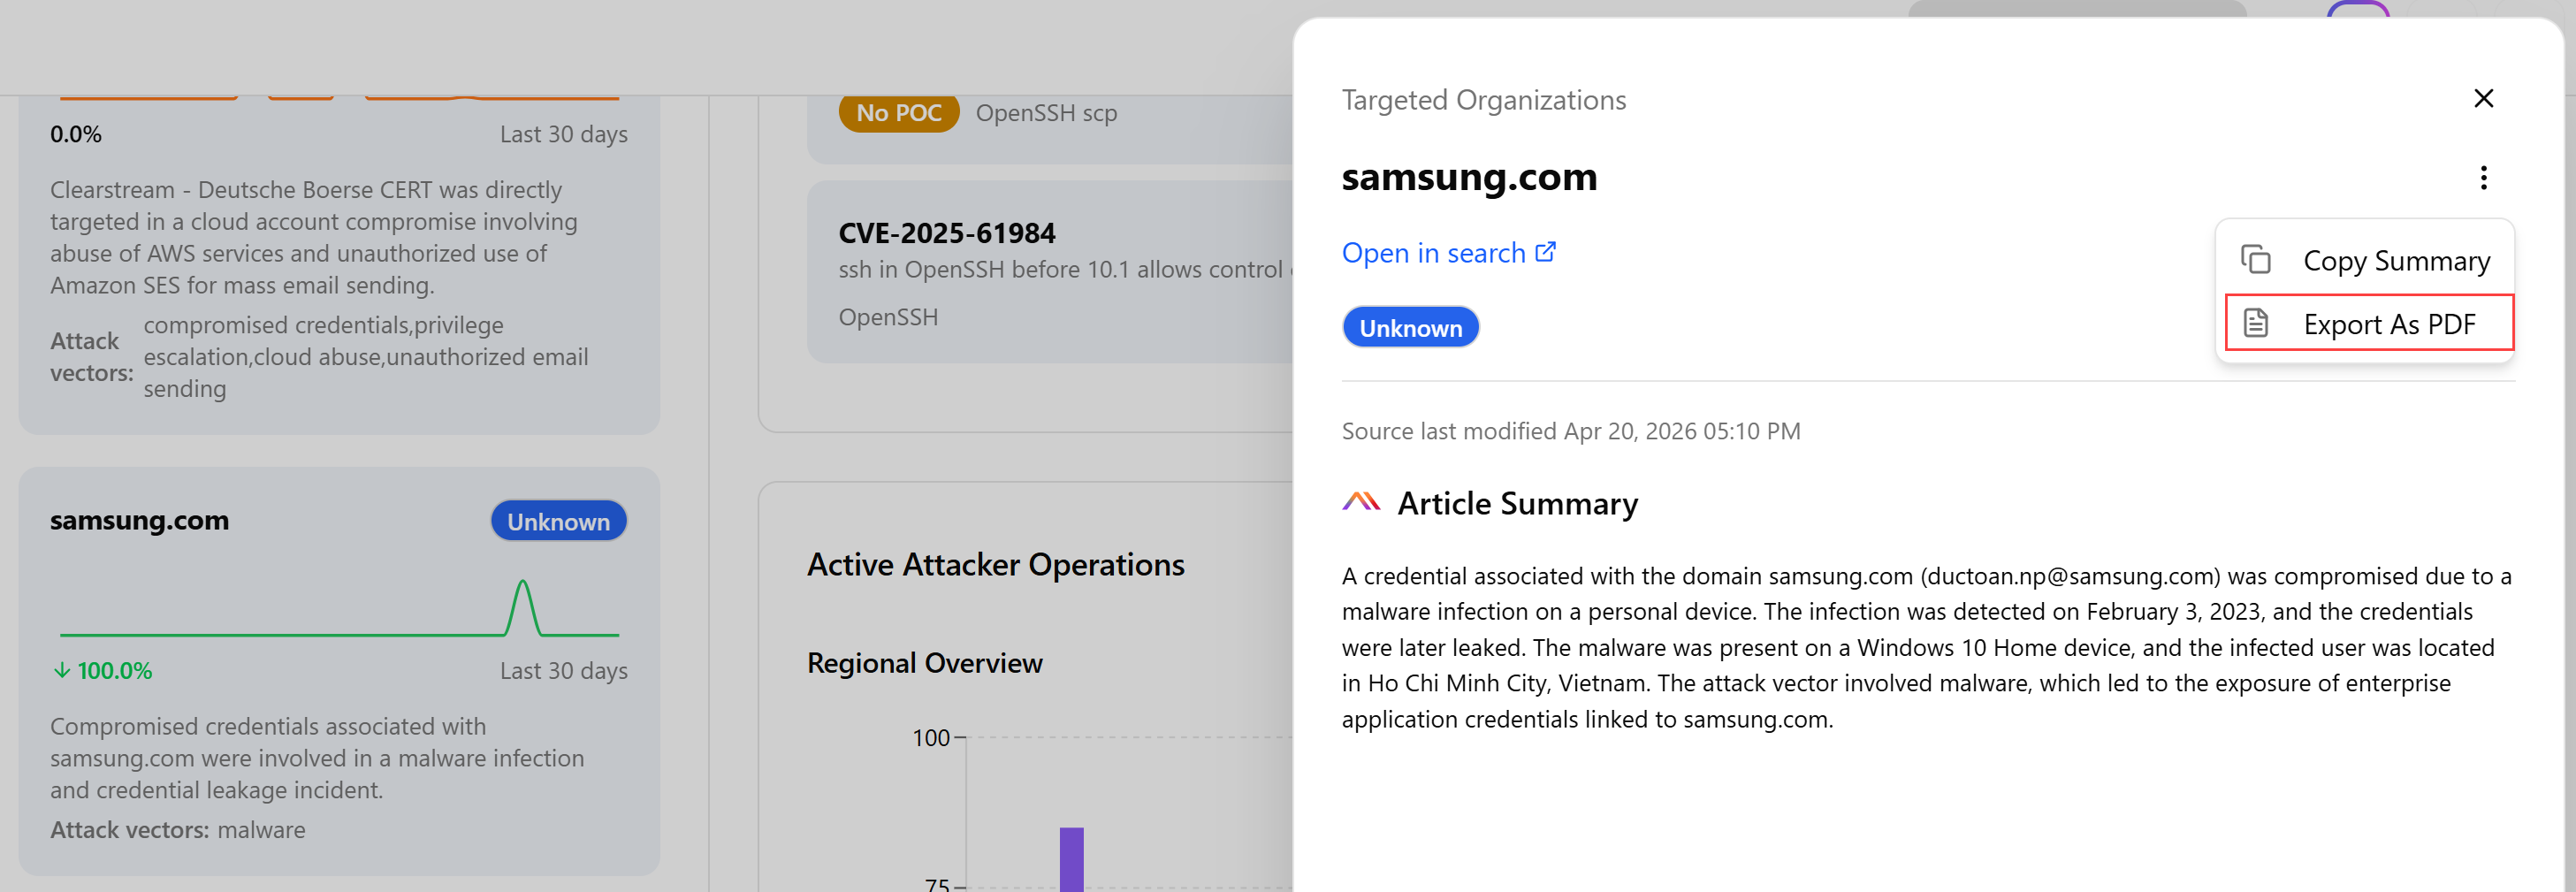
-