Visualizing Threats With MyEvents Map
MyEvents Map is an interactive tool that enables you to visualize the geographic location of threats around the world. Though not a live view, MyEvents Map replays the most recent intelligence available to you on ThreatStream. When opened, the map queries the most recent 1000 observables based on the display mode you selected.
There are three display modes:
- Recent observables: Replays the most recent observables added to ThreatStream.
- Saved Searches: Replays the most recent observables from search queries you have saved.
- Recent MyAttacks Events: Replays observables that triggered alerts on integrated destinations such as ArcSight ESM or Splunk.
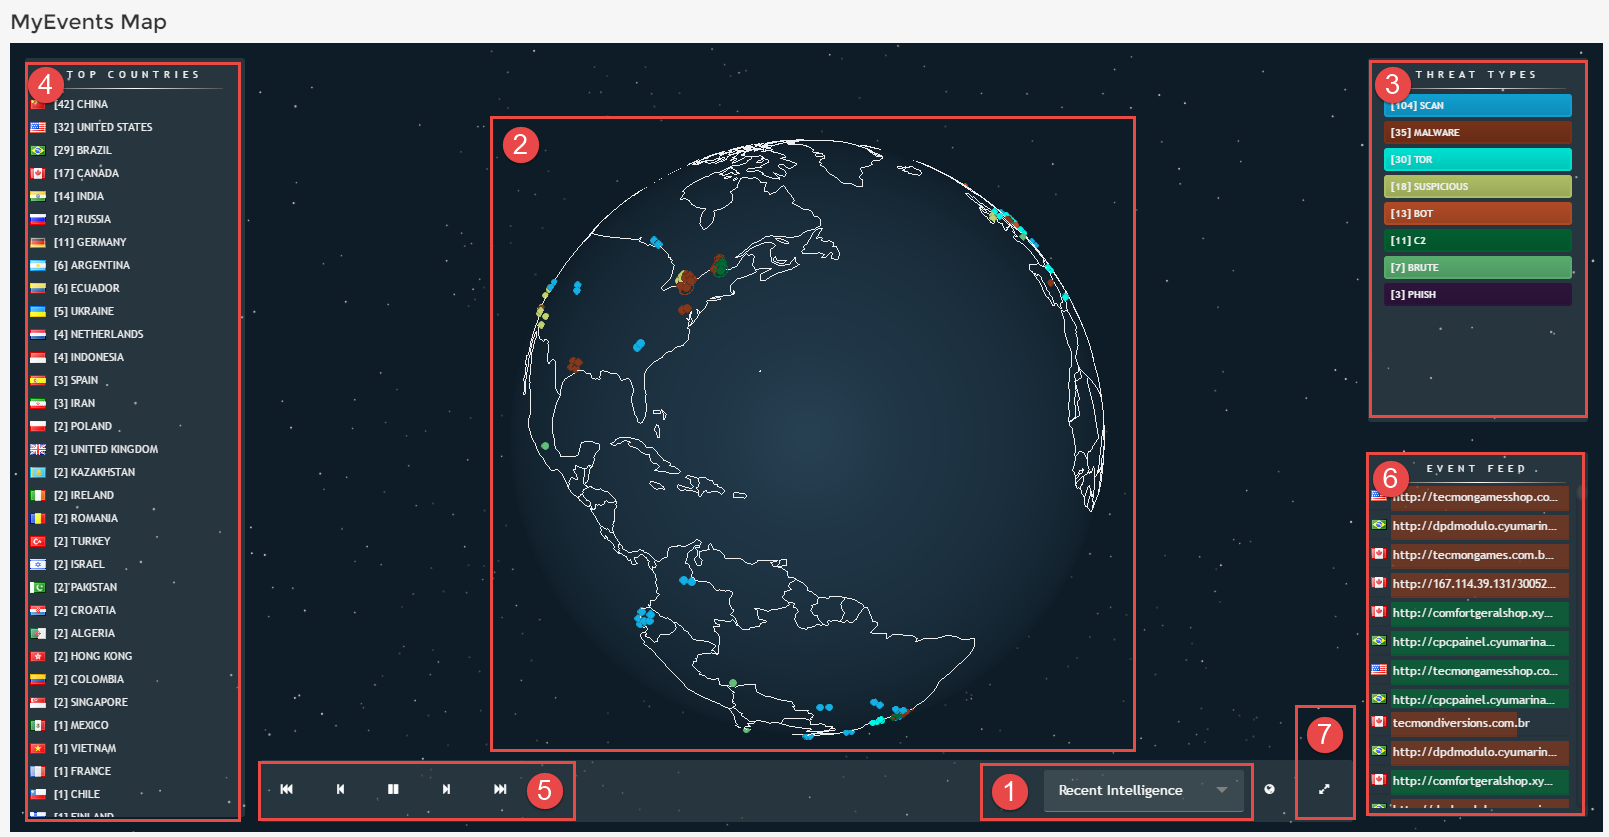
 Toggle the Display Mode. In addition to viewing Recent Intelligence, you can view data on MyEvents Map based on saved searches created by your organization. Saved searches appear in the order they were saved.
 Hover over the globe to stop rotation. You can zoom in on the globe by hovering over and scrolling. Country names are displayed when you zoom in.
 Types of threats displayed on the map. You can disable a Threat Type and remove all related observables from the map by clicking it.
 List of countries ordered by the number of observables on the map relating to each.
 Playback controls. Rewinding the map removes observables and Fast Forwarding adds them back. Pausing the map prevents new observables from being added.
 Feed of observables as they are added to the map. The length of each bar represents the Confidence score of the observable. You can hover over observables to view Confidence scores.
 Toggle Full Screen view.